Page 102 - Interloop Annual Report 2018-2019
P. 102

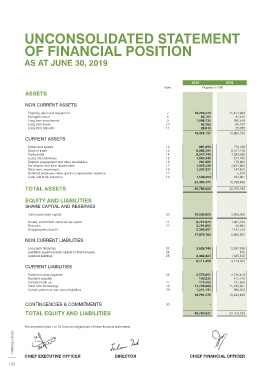
UNCONSOLIDATED STATEMENT                                                                                                      UNCONSOLIDATED STATEMENT


            OF FINANCIAL POSITION                                                                                                         OF PROFIT OR LOSS


            AS AT JUNE 30, 2019                                                                                                           FOR THE YEAR ENDED JUNE 30, 2019


                                                                                     2019           2018                                                                                                           2019           2018
                                                                         Note             Rupees in ‘000                                                                                               Note             Rupees in ‘000
            ASSETS
                                                                                                                                          Sales - net                                                   31           37,478,321     31,138,736
                                                                                                                                          Cost of sales                                                 32          (25,523,607)    (21,994,237)
            NON CURRENT ASSETS                                                                                                            Gross profit                                                               11,954,714      9,144,499
             Property, plant and equipment                                7            18,256,474     15,451,969
             Intangible asset                                             8              66,161          42,410                           Operating expenses
             Long term investments                                        9            1,008,735        380,549
             Long term loans                                              10             65,762          60,747                            Distribution cost                                            33           (2,783,719)    (2,641,013)
             Long term deposits                                           11             28,019          25,055                            Administrative expenses                                      34           (1,984,209)    (1,597,804)
                                                                                       19,425,151     15,960,730                           Other operating expenses                                     35            (784,540)       (425,429)
                                                                                                                                                                                                                        14,444
                                                                                                                                                                                                                                        9,164
            CURRENT ASSETS                                                                                                                 Other income                                                 36           (5,538,024)    (4,655,082)
                                                                                                                                          Profit from operations                                                      6,416,690      4,489,417
             Stores and spares                                            12             887,659        779,198
             Stock in trade                                               13           6,282,491       5,121,718
             Trade debts                                                  14           8,247,740       7,293,008                           Finance cost                                                 37            (995,707)       (483,654)
             Loans and advances                                           15           1,063,342        617,743
             Deposit, prepayment and other receivables                    16             204,985        179,864                           Profit before taxation                                                      5,420,983      4,005,763
             Tax refunds due from Government                              17           1,925,439       2,451,806
             Short term investments                                       18           1,207,251        147,425
             Deferred employee share option compensation expense          22                 -           5,014                             Taxation                                                     38            (226,216)       (119,954)
             Cash and bank balances                                       19           1,538,564        193,687
                                                                                       21,357,471     16,789,463                          Profit for the year                                                         5,194,767      3,885,809
            TOTAL ASSETS                                                               40,782,622     32,750,193

            EQUITY AND LIABILITIES                                                                                                        Earnings per share - basic (Rupees)                          39.1             6.6706         5.1007
            SHARE CAPITAL AND RESERVES                                                                                                    Earnings per share - diluted (Rupees)                        39.2             6.6706         5.1003
             Authorized share capital                                     20           10,000,000      3,000,000
             Issued, subscribed and paid up capital                       21           8,721,975       1,901,104                          The annexed notes 1 to 52 form an integral part of these financial statements.
             Reserves                                                     22           3,791,602         38,863
             Unappropriated profit                                                     5,366,207       7,142,570
                                                                                       17,879,784      9,082,537
            NON CURRENT LIABILITIES
             Long term financing                                          23           3,628,745       2,247,936
             Liabilities against assets subject to finance lease          24                 -            615
             Deferred liabilities                                         25           2,482,623       1,925,612
                                                                                       6,111,368       4,174,163
            CURRENT LIABILITIES
             Trade and other payables                                     26           3,576,861       2,730,414
             Dividend payable                                                            130,935        475,276
             Accrued mark up                                              27             110,483        137,856
             Short term borrowings                                        28           11,726,000     15,180,937
             Current portion of non current liabilities                   29           1,247,191        969,010
                                                                                       16,791,470     19,493,493
            CONTINGENCIES & COMMITMENTS                                   30                 -              -
            TOTAL EQUITY AND LIABILITIES                                               40,782,622     32,750,193


            The annexed notes 1 to 52 form an integral part of these financial statements.                                                                                                                                                       2018 - 19
       Interloop Limited                                                                                                                                                                                                                         Annual Report


            CHIEF EXECUTIVE OFFICER                DIRECTOR                         CHIEF FINANCIAL OFFICER                               CHIEF EXECUTIVE OFFICER                DIRECTOR                         CHIEF FINANCIAL OFFICER
     100                                                                                                                                                                                                                                       101
   97   98   99   100   101   102   103   104   105   106   107