
Page 90 - Interloop Annual Report 2018-2019
P. 90
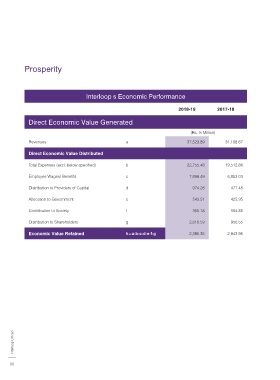
Prosperity


                                       InterloopÍs Economic Performance


                                                                               2018-19          2017-18

              Direct Economic Value Generated

                                                                                    (Rs. In Million)

              Revenues                                  a                          37,523.89        31,168.67

              Direct Economic Value Distributed

              Total Expenses (excl. below specified)    b                          22,755.48        19,512.86

              Employee Wages/ Benefits                  c                           7,898.49         6,853.03

              Distribution to Providers of Capital      d                             974.28          477.48


              Allocation to Government                  e                             543.51          425.95

              Contribution to Society                   f                             350.18          104.85

              Distribution to Shareholders              g                           2,616.59          950.55

              Economic Value Retained                   h=a-b-c-d-e-f-g             2,385.35         2,843.95


       Interloop Limited


     88