
Page 196 - InterloopAnnualReport2020
P. 196
NOTES TO THE UNCONSOLIDATED
FINANCIAL STATEMENTS
For the year ended June 30, 2020
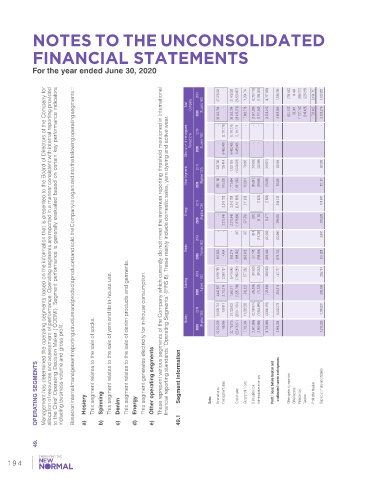
allocation of resources and assessment of performance. Operating segments are reported in a manner consistent with internal reporting provided
to the Chief Operating Decision Maker (‘CODM’). Segment performance is generally evaluated based on certain key performance indicators
Based on internal management reporting structure and products produced and sold, the Company is organized into the following operating segments ::
Management has determined the operating segments based on the information that is presented to the Board of Directors of the Company for
2019 37,478,321 - 37,478,321 (25,523,607) 11,954,714 (2,783,719) (1,984,209) (4,767,928) 7,186,786 (784,540) 14,444 (995,707) (226,216) 5,194,767 1,650,281
Total Company (Rupees ‘000) -
2020 36,302,794 - 36,302,794 (28,439,076) 7,863,718 - (2,007,264) - (2,197,949) - (4,205,213) - 3,658,505 - (504,513) 99,001 (1,137,162) (319,428) 1,796,403 2,012,276 -
financial reporting standards ‘Operating Segments’ (IFRS 8). These mainly include domestic sales, yarn dyeing and active wear.
Elimination of Intersegment 2019 (Rupees ‘000) (6,191,770) (6,191,770) 6,191,770
Transactions 2020 - (6,483,405) (6,483,405) 6,483,405 - - - - - -
2019 328,745 793,414 1,122,159 (1,049,093) 73,066 (16,929) (33,068) (49,997) 23,069 82,089
Other Segments (Rupees ‘000)
2020 855,168 916,326 1,771,494 (1,657,583) 113,911 (45,641) (29,965) (75,606) 38,305 86,167
- - (7,623) (7,623)
2019 2,343,788 2,343,788 (2,131,853) 211,935 204,312 174,947
Energy (Rupees ‘000) - (295)
2020 2,276,445 2,276,445 (1,878,886) 397,559 (8,182) (8,477) 389,082 180,328
- - - (87) (87) (814) 3,647
2019 (19,789) (20,603) (20,690)
Denim (Rupees ‘000)
These represent various segments of the Company which currently do not meet the minimum reporting threshold mentioned in International 4,454
2020 990,820 995,274 (1,688,682) (693,408) (97,748) (60,302) (188,596) (69,243) (286,344) (129,545) (979,752) 304,268
This segment relates to the sale of denim products and garments.
consumption. in-house for Spinning Hosiery 2019 2020 2019 2020 Rupees in ‘000 (Rupees ‘000) 5,519,785 4,443,897 31,629,791 30,012,909 2,950,757 3,119,214 103,811 166,966 8,470,542 7,563,111 31,733,602 30,179,875 (7,893,280) (7,220,789) (20,641,064) (22,476,541) 577,262 342,322 11,092,538 7,703,334 (55,584) (2,705,674) (1,807,996) (70,22
OPERATING SEGMENTS including business volume and gross profit. Hosiery This segment relates to the sale of socks. Spinning This segment relates to the sale of yarn and its in-house use. Denim Energy electricity generates segment This Other operating segments Segment information Sales External sales Intersegment sales Cost of sales Gross profit / (loss) Distribution cost Administrative expenses Profit / (loss) before taxation
c)
b)
d)
a)
e)
49.1
49.
194