
Page 145 - InterloopAnnualReport2021
P. 145
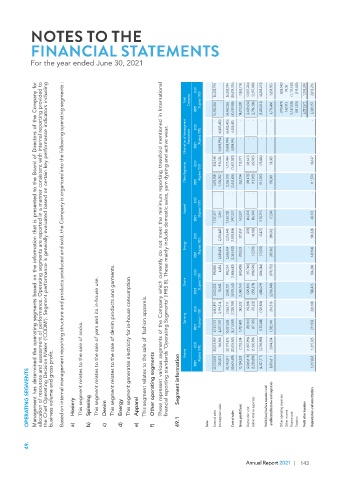
NOTES TO THE

            FINANCIAL STATEMENTS


            For the year ended June 30, 2021


                  the Chief Operating Decision Maker (‘CODM’). Segment performance is generally evaluated based on certain key performance indicators including
                                                          These represent various segments of the Company which currently do not meet the minimum reporting threshold mentioned in International
                       Based on internal management reporting structure and products produced and sold, the Company is organized into the following operating segments :
                allocation of resources and assessment of performance. Operating segments are reported in a manner consistent with internal reporting provided to
              Management has determined the operating segments based on the information that is presented to the Board of Directors of the Company for
                                                                      2020    36,302,794    -      36,302,794    (28,439,076)   7,863,718    (2,007,264)   (2,197,949)   (4,205,213)   3,658,505    (505,542)   99,001    (1,137,162)   (319,428)   1,795,374   2,012,276
                                                                  Total   Company  (Rupees ‘000)   -
                                                                      2021    -      54,962,265     54,962,265     (40,749,985)    -      14,212,280     (2,639,632)    (2,796,180)    (5,435,812)    8,776,468     (919,479)    162,912     (1,147,038)    (581,292)    6,291,571     2,339,157
                                                                  Elimination of Intersegment   Transactions   (Rupees ‘000)    -       -       -       -       -                      -
                                                                      2020      (6,483,405)    (6,483,405)    6,483,405     -       -       -       -                      -
                                                            financial reporting standards ‘Operating Segments’ (IFRS 8). These mainly include domestic sales, yarn dyeing and active wear.

                                                                      2021   -     (8,898,994)    (8,898,994)    8,898,994


                                                                      2020     855,168      916,326     1,771,494     (1,657,583)    113,911     (45,641)    (29,965)    (75,606)    38,305                    86,167
                                                                  Other Segments      (Rupees ‘000)


                                                                      2021     1,575,958     1,130,052     2,706,010     -       (2,443,826)     262,184     (98,478)    (12,905)    (111,383)     150,801      111,574
                                                                              -       -       -       -       -       -       -       -                      -
                                                                      2020

                                                                  Apparel      (Rupees ‘000)
                                                                      2021    1,157,477     3,261     1,160,738     (997,231)    163,507     (84,374)    (86,341)    (170,715)    (7,208)    40,172

                                                                              -           (295)
                                                                      2020      2,276,445     2,276,445     (1,878,886)    397,559     (8,182)    (8,477)    389,082     180,328
                                                                  Energy      (Rupees ‘000)    -       -

                                                                      2021      2,638,434     2,638,434     (2,344,902)    293,532     (12,570)    (12,570)    280,962     169,940

                                                                                4,454
                                         This segment relates to the sale of denim products and garments.
                                                                      2020    990,820     995,274     (1,688,682)    (693,408)    (97,748)    (188,596)    (286,344)    (979,752)    304,268
                                               This segment generates electricity for in-house consumption.
                                   This segment relates to the sale of yarn and its in-house use.
                                                                  Denim      (Rupees ‘000)
                                                                      2021    3,572,053     18,648     3,590,701     (4,939,462)    (1,348,761)    (329,801)    (358,278)    (688,079)    (2,036,840)    588,473
                                                    This segment relates to the sale of  fashion apparels.
                                                                                       342,322     (55,584)    (70,222)    (125,806)    216,516                    226,188
                                                                      2020    4,443,897     3,119,214     7,563,111     (7,220,789)
                                                                  Spinning   Hosiery         2021   2020   Rupees in ‘000  (Rupees ‘000)    5,143,772    30,012,909     4,877,787    166,966     10,021,558    30,179,875     (8,314,069)   (22,476,541)    1,707,489    7,703,334     (58,161)   (1,807,996)    (67,187)   (1,900,984)    (125,348)   (3,708,980)    1,582,141    3,994,354                                                  211,933    1,215,325


           OPERATING SEGMENTS   business volume and gross profit.  Hosiery  This segment relates to the sale of socks.   Spinning   Denim   Energy   Apparel  Other operating segments   Segment information        2021       43,513,005        230,812   Intersegment sales    43,743,817        (30,609,489)      13,134,328   Gross profit/(loss)    (2,068,818)  Distribution cost       (2,258,899)  Administrative expenses    (4,327,717)     Profit/(loss) before taxation and    8


                                 b)
                                            d)
                           a)
                                                 e)
                                      c)


                                                       f)       49.1         Sales   External sales      Cost of sales         Other income   Finance cost   Taxation
           49.
                                                                                                           143