
Page 39 - InterloopAnnualReport2021
P. 39
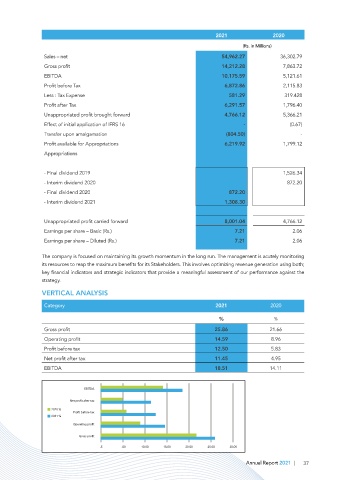
2021                2020

                                                                                             (Rs. in Millions)
                 Sales – net                                                         54,962.27     36,302.79
                 Gross profit                                                        14,212.28      7,863.72
                 EBITDA                                                              10,175.59      5,121.61
                 Profit before Tax                                                     6,872.86     2,115.83
                 Less : Tax Expense                                                       581.29     319.428
                 Profit after Tax                                                      6,291.57     1,796.40

                 Unappropriated profit brought forward                                 4,766.12     5,366.21
                 Effect of initial application of IFRS 16                                            -              (0.67)
                 Transfer upon amalgamation                                             (804.50)                   -
                 Profit available for Appropriations                                   6,219.92     1,799.12
                 Appropriations

                 - Final dividend 2019                                                              1,526.34

                 - Interim dividend 2020                                                              872.20
                 - Final dividend 2020                                                    872.20
                 - Interim dividend 2021                                               1,308.30

                 Unappropriated profit carried forward                                 8,001.04     4,766.12
                 Earnings per share – Basic (Rs.)                                              7.21     2.06
                 Earnings per share – Diluted (Rs.)                                            7.21     2.06


                The company is focused on maintaining its growth momentum in the long run. The management is acutely monitoring
                its resources to reap the maximum benefits for its Stakeholders. This involves optimizing revenue generation using both;
                key financial indicators and strategic indicators that provide a meaningful assessment of our performance against the
                strategy.

                VERTICAL ANALYSIS
                 Category                                                    2021               2020


                                                                              %                  %
                 Gross profit                                               25.86               21.66
                 Operating profit                                           14.59               8.96
                 Profit before tax                                          12.50               5.83
                 Net profit after tax                                       11.45               4.95
                 EBITDA                                                     18.51               14.11


                               EBITDA

                          Net profit after tax
                   2020 %
                           Profit before tax
                   2021 %
                           Operating profit
                             Gross profit

                                    -5      .00    10.00  15.00   20.00   25.00   30.00

                                                                                       Annual Report 2021  |  37