Page 62 - InterloopLimitedSR2020
P. 62

USING RESOURCES EFFICIENTLY                                                                                                   REDUCING EMISSIONS


            AND RESPONSIBLY                                                                                                               AND WASTES


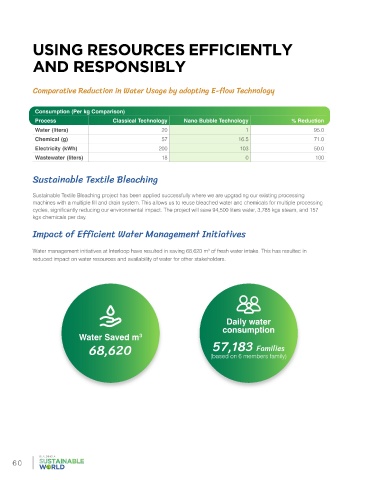
            Comparative Reduction in Water Usage by adopting E-flow Technology                                                            GHG Emissions

                                                                                                                                          Greenhouse gas emissions occur as   temperatures well below 2 degrees   Protection Agency (EPA), under
             Consumption (Per kg Comparison)
                                                                                                                                          a result of combustion processes in   Celsius, above pre-industrial levels.   Punjab Environmental Quality
             Process                   Classical Technology   Nano Bubble Technology             % Reduction                              industries and are a major cause of   This requires introduction of cleaner   Standards (PEQs). We regularly
             Water (liters)                           20                          1                      95.0                             climate change. Changing climatic   technologies and continuous up-  monitor greenhouse gas emissions
                                                                                                                                          conditions across the globe require   gradation of operations. The GHG   at our production units to ensure
             Chemical (g)                              57                       16.5                     71.0
                                                                                                                                          immediate actions by corporates   emissions at Interloop are the result   compliance with control limits, as well
             Electricity (kWh)                        200                        103                     50.0                             to reduce emissions from their   of multiple operational processes and   as meeting the targets set in these
             Wastewater (liters)                       18                          0                     100                              operations in order to keep the   subject to limits set by Environmental   areas as part of our five-year plan.


            Sustainable Textile Bleaching                                                                                                                                Unit           FY 2020        FY 2019       FY 2018        FY 2017
                                                                                                                                           GHG Emissions (Scope I)        Mt              90,521        68,579        123,196        78,447
            Sustainable Textile Bleaching project has been applied successfully where we are upgrading our existing processing             GHG Emissions (Scope II)       Mt              22,847        46,976         7,504         27,653
            machines with a multiple fill and drain system. This allows us to reuse bleached water and chemicals for multiple processing   Total Emissions                Mt             113,368       115,555        130,700       106,100
            cycles, significantly reducing our environmental impact. The project will save 94,500 liters water, 3,785 kgs steam, and 157
            kgs chemicals per day.
                                                                                                                                          CO , CH , N O gases are included in the calculation of CO e emissions. No biogenic emissions occur at Interloop. The
                                                                                                                                            2
                                                                                                                                                4
                                                                                                                                                                                       2
                                                                                                                                                   2
                                                                                                                                          source of emission factors were derived from IPCC’s 5  assessment report.
                                                                                                                                                                                    th
            Impact of Efficient Water Management Initiatives
                                                                                                                                                                         Unit           FY 2020        FY 2019       FY 2018        FY 2017
            Water management initiatives at Interloop have resulted in saving 68,620 m  of fresh water intake. This has resulted in        Reduction in GHG
                                                                      3
            reduced impact on water resources and availability of water for other stakeholders.                                            Emissions through multiple     Mt              15,226         9,090        16,181          8,687
                                                                                                                                           initiatives
                                                                                                                                          CO , NH , N O gases are included in the calculation of CO e emissions
                                                                                                                                            2   4  2                                   2


                                                                                                                                                G�� Emi����n
                                                                            Daily water                                                         (Mt)
                                                                           consumption                                                    150,000
                           Water Saved m       3

                              68,620                                   57,183 Families                                                                                         130,700
                                                                       (based on 6 members family)                                        120,000                                                    115,555

                                                                                                                                                         106,100                                                           113,368

                                                                                                                                           90,000
                                                                                                                                                        FY 2017                FY 2018               FY 2019                F� 2020


     60                                                                                                                                                                                                                                        61
   57   58   59   60   61   62   63   64   65   66   67