Page 172 - Interloop Annual Report 2018-2019
P. 172

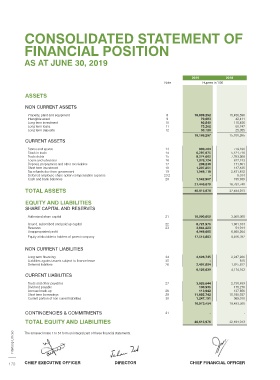
CONSOLIDATED STATEMENT OF                                                                                                     CONSOLIDATED STATEMENT OF


            FINANCIAL POSITION                                                                                                            PROFIT OR LOSS


            AS AT JUNE 30, 2019                                                                                                           FOR THE YEAR ENDED JUNE 30, 2019


                                                                                     2019           2018                                                                                                           2019           2018
                                                                         Note             Rupees in ‘000                                                                                               Note             Rupees in ‘000
                                                                                                                                          Sales - net                                                   32           37,511,062     32,141,958
            ASSETS                                                                                                                        Cost of sales                                                 33          (25,643,715)    (22,883,089)
                                                                                                                                          Gross profit                                                               11,867,347      9,258,869
            NON CURRENT ASSETS
                                                                                                                                          Operating expenses
             Property, plant and equipment                                8            18,899,292     15,456,596
             Intangible asset                                             9              70,083          42,411                            Distribution cost                                            34           (2,794,393)    (2,641,013)
             Long term investment                                        10              93,540         115,456                            Administrative expenses                                      35           (2,028,640)    (1,639,210)
             Long term loans                                             11              73,262          60,747                            Other operating expenses                                     36            (714,202)       (603,026)
             Long term deposits                                          12              33,120          25,055                            Other income                                                 37              14,444         55,087
                                                                                       19,169,297     15,700,265
            CURRENT ASSETS                                                                                                                Profit from operations                                                     (5,522,791)    (4,828,162)
                                                                                                                                                                                                                      6,344,556
                                                                                                                                                                                                                                     4,430,707
             Stores and spares                                           13              890,404        779,198
             Stock in trade                                              14            6,297,975       5,121,718                           Finance cost                                                 38            (999,260)       (498,956)
             Trade debts                                                 15            8,274,062       7,293,008                           Gain from changes in fair value less costs to sell of biological assets  39     -            9,245
             Loans and advances                                          16            1,076,724        617,743
             Deposit, prepayment and other receivables                   17              208,238        171,891                            Share of loss from associate                                10.1            (58,485)       (53,032)
             Short term investment                                       18            1,207,251        147,425
             Tax refunds due from government                             19            1,949,118       2,451,812                          Profit before taxation                                                      5,286,811      3,887,964
             Deferred employee share option compensation expense         23.2                -           5,014
             Cash and bank balances                                      20            1,542,907        195,939                            Taxation                                                     40            (226,260)       (153,248)
                                                                                       21,446,679     16,783,748
            TOTAL ASSETS                                                               40,615,976     32,484,013                          Profit for the year                                                         5,060,551      3,734,716

                                                                                                                                          Attributable to:
            EQUITY AND LIABILITIES
            SHARE CAPITAL AND RESERVES                                                                                                    Shareholders of parent company                                              5,060,551      3,718,765
                                                                                                                                          Non- controlling interest                                                        -           15,951
             Authorized share capital                                    21            10,000,000      3,000,000                                                                                                      5,060,551      3,734,716
             Issued, subscribed and paid up capital                      22            8,721,975       1,901,104
             Reserves                                                    23            3,844,223         54,914                           Earnings per share - basic (Rupees)                          41.1             6.4983         4.8814
             Unappropriated profit                                                     4,949,685       6,860,264
             Equity attributable to holders of parent company                          17,515,883      8,816,282                          Earnings per share - diluted (Rupees)                        41.2             6.4983         4.8811

            NON CURRENT LIABILITIES                                                                                                       The annexed notes 1 to 54 form an integral part of these financial statements.

             Long term financing                                         24            3,628,745       2,247,936
             Liabilities against assets subject to finance lease         25                  -            615
             Deferred liabilities                                        26            2,497,894       1,925,612
                                                                                       6,126,639       4,174,163
            CURRENT LIABILITIES
             Trade and other payables                                    27            3,625,644       2,730,489
             Dividend payable                                                            130,935        475,276
             Accrued mark up                                             28              113,942        137,856
             Short term borrowings                                       29            11,855,742     15,180,937
             Current portion of non current liabilities                  30            1,247,191        969,010
                                                                                       16,973,454     19,493,568
            CONTINGENCIES & COMMITMENTS                                  31                  -              -

            TOTAL EQUITY AND LIABILITIES                                               40,615,976     32,484,013                                                                                                                                 2018 - 19

       Interloop Limited  The annexed notes 1 to 54 form an integral part of these financial statements.                                                                                                                                         Annual Report


     170    CHIEF EXECUTIVE OFFICER                DIRECTOR                         CHIEF FINANCIAL OFFICER                               CHIEF EXECUTIVE OFFICER                DIRECTOR                         CHIEF FINANCIAL OFFICER      171
   167   168   169   170   171   172   173   174   175   176   177