Page 174 - Interloop Annual Report 2018-2019
P. 174

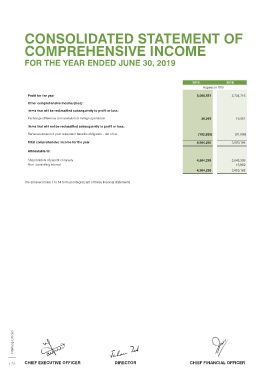
CONSOLIDATED STATEMENT OF                                                                                                     CONSOLIDATED STATEMENT OF


            COMPREHENSIVE INCOME                                                                                                          CHANGES IN EQUITY


            FOR THE YEAR ENDED JUNE 30, 2019                                                                                              FOR THE YEAR ENDED JUNE 30, 2019


                                                                                                                                                                                     Attributable to Owners of the Parent
                                                                                     2019           2018                                                                       Capital
                                                                                          Rupees in ‘000                                                                       Reserve    Revenue Reserves
                                                                                                                                                                                      Employee                                Non
             Profit for the year                                                        5,060,551      3,734,716                                                        Share          Share   Unappro-   Trans-   Sub-total   Total  Controlling    Total
                                                                                                                                                                       Capital  Share   Option   priated             lation   Interest
             Other comprehensive income/(loss):                                                                                                                                Premium  Compen-  Profit  Reserves
                                                                                                                                                                                       sation
             Items that will be reclassified subsequently to profit or loss:                                                                                                          Reserve
                                                                                                                                                                                                     Rupees in ‘000
             Exchange difference on translation of foreign operations                     36,569         16,051
                                                                                                                                          Balance as at July 01, 2017   1,899,385    19,424    1,629   12,407,930    -     12,428,983   14,328,368    671,560    14,999,928
             Items that will not be reclassified subsequently to profit or loss:
             Remeasurement of post retirement benefits obligation - net of tax          (192,825)       (91,599)                          Profit for the year                -       -      -      3,718,765    -      3,718,765    3,718,765    15,951    3,734,716
             Total comprehensive income for the year                                    4,904,295      3,659,168                          Other comprehensive income/(loss)   -      -      -      (91,507)   16,051    (75,456)   (75,456)   (92)   (75,548)
                                                                                                                                          Total comprehensive income for the year   -      -      -      3,627,258    16,051    3,643,309    3,643,309    15,859    3,659,168
             Attributable to:
                                                                                                                                          Transactions with owners:
             Shareholders of parent company                                             4,904,295      3,643,309                          Issuance of shares of subsidiary   -       -      -       -      -      -       -      3,000    3,000
             Non- controlling interest                                                        -          15,859
                                                                                        4,904,295      3,659,168                          Dividend to ordinary shareholders   -      -      -      (950,552)   -      (950,552)   (950,552)   -      (950,552)
                                                                                                                                                                             -       -      -      (950,552)   -      (950,552)   (950,552)   3,000    (947,552)
            The annexed notes 1 to 54 form an integral part of these financial statements.                                                Transferred to Interloop Holdings (Pvt) Ltd
                                                                                                                                          pursuant to Scheme of Arrangement   -      -      -     (8,224,372)   -      (8,224,372)  (8,224,372)   -      (8,224,372)
                                                                                                                                          Disposal of Interloop Dairies Limited   -      -      -      -      -      -      -      (690,419)   (690,419)
                                                                                                                                          Employees share option scheme      -       -      8,234    -      -      8,234    8,234    -      8,234
                                                                                                                                          Shares issued under the ESOS    1,719    10,831    (1,255)   -      -      9,576    11,295    -      11,295
                                                                                                                                          Balance as at June 30, 2018   1,901,104    30,255    8,608   6,860,264    16,051   6,915,178   8,816,282    -      8,816,282
                                                                                                                                          Profit for the year                -       -      -     5,060,551    -     5,060,551   5,060,551    -      5,060,551
                                                                                                                                          Other comprehensive income/(loss)   -      -      -      (192,825)   36,569    (156,256)   (156,256)   -      (156,256)
                                                                                                                                          Total comprehensive income for the year   -      -      -     4,867,726    36,569   4,904,295   4,904,295    -      4,904,295
                                                                                                                                          Transactions with owners:
                                                                                                                                          Dividend to ordinary shareholders   -      -      -     (1,090,247)   -     (1,090,247) (1,090,247)   -      (1,090,247)
                                                                                                                                                                             -       -      -     (1,090,247)   -     (1,090,247) (1,090,247)   -      (1,090,247)
                                                                                                                                          Employees share option scheme      -       -      18      -      -      18     18       -       18
                                                                                                                                          Shares issued under the ESOS    7,558    27,523    (8,626)   -      -      18,897    26,455    -      26,455
                                                                                                                                          Issuance of ordinary shares   1,095,000    3,934,900    -      -      -     3,934,900   5,029,900    -      5,029,900
                                                                                                                                          Transaction cost on issuance of shares   -      (170,820)   -      -      -      (170,820)   (170,820)   -      (170,820)
                                                                                                                                          Issuance of bonus shares     5,718,313    (30,255)   -     (5,688,058)   -     (5,718,313)   -      -      -
                                                                                                                                          Balance as at June 30, 2019   8,721,975    3,791,603    -     4,949,685    52,620   8,793,908   17,515,883    -      17,515,883


                                                                                                                                          The annexed notes 1 to 54 form an integral part of these financial statements.
                                                                                                                                                                                                                                                 2018 - 19
       Interloop Limited                                                                                                                                                                                                                         Annual Report


     172    CHIEF EXECUTIVE OFFICER                DIRECTOR                         CHIEF FINANCIAL OFFICER                               CHIEF EXECUTIVE OFFICER                DIRECTOR                         CHIEF FINANCIAL OFFICER      173
   169   170   171   172   173   174   175   176   177   178   179