
Page 270 - InterloopAnnualReport2020
P. 270
NOTES TO THE CONSOLIDATED
FINANCIAL STATEMENTS
For the year ended June 30, 2020
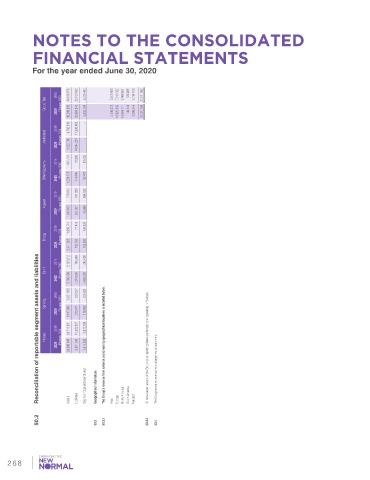
2019 5,315,450 3,940,408 17,013,762 12,488,901 333,885 3,734,106 37,511,062
Group Total (Rupees ‘000) 45,249,956 40,615,976 28,984,845 23,100,093
2020 6,632,764 4,448,375 16,929,653 12,064,741 146,146 3,208,245 36,797,159
2019 4,792,810 -
Unallocated (Rupees ‘000) 14,544,251 11,836,483 -
2020 3,222,788
Other Segments 2019 2020 (Rupees ‘000) 1,010,431 1,234,578 78,965 149,644 61,423 92,471
2019 749,010 197,258 654,528
Apparel (Rupees ‘000)
2020 1,240,933 897,207 96,588
2019 1,969,744 77,475 159,820
Energy (Rupees ‘000)
2020 2,041,263 102,380 152,580
Reconciliation of reportable segment assets and liabilities
2019 2,121,212 180,548 1,242,499
Denim (Rupees ‘000)
2020 6,796,488 4,214,550 4,658,092
2019 5,261,938 206,537 225,021
Spinning (Rupees ‘000)
2020 6,017,860 215,471 119,098
2019 24,710,831 10,522,827 2,972,159
Hosiery (Rupees ‘000)
2020 24,696,046 8,861,342 1,513,935 The Group’s revenue from external customers by geographical locations is detailed below: All non–current assets of the Group as at reporting dates are located and operating in Pakistan.
Segment Capital Expenditures Geographical information The Group earns its revenue from a large mix of customers.
(Rupees ‘000) North America South America
2020 Assets Liabilities Asia Europe Pakistan
50.2 50.3 50.3.1 50.3.2 50.4
268