
Page 271 - InterloopAnnualReport2020
P. 271
NOTES TO THE CONSOLIDATED
FINANCIAL STATEMENTS
For the year ended June 30, 2020
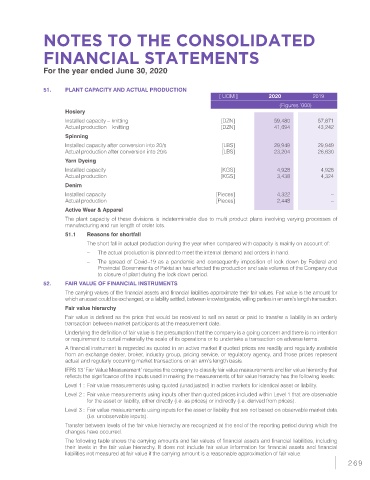
51. PLANT CAPACITY AND ACTUAL PRODUCTION
[ UOM ] 2020 2019
(Figures ‘000)
Hosiery
Installed capacity – knitting [DZN] 59,480 57,871
Actual production – knitting [DZN] 41,694 43,242
Spinning
Installed capacity after conversion into 20/s [LBS] 29,949 29,949
Actual production after conversion into 20/s [LBS] 23,204 26,630
Yarn Dyeing
Installed capacity [KGS] 4,928 4,928
Actual production [KGS] 3,438 4,324
Denim
Installed capacity [Pieces] 4,322 –
Actual production [Pieces] 2,448 –
Active Wear & Apparel
The plant capacity of these divisions is indeterminable due to multi product plans involving varying processes of
manufacturing and run length of order lots.
51.1 Reasons for shortfall
The short fall in actual production during the year when compared with capacity is mainly on account of:
– The actual production is planned to meet the internal demand and orders in hand.
– The spread of Covid–19 as a pandemic and consequently imposition of lock down by Federal and
Provincial Governments of Pakist an has effected the production and sale volumes of the Company due
to closure of plant during the lock down period.
52. FAIR VALUE OF FINANCIAL INSTRUMENTS
The carrying values of the financial assets and financial liabilities approximate their fair values. Fair value is the amount for
which an asset could be exchanged, or a liability settled, between knowledgeable, willing parties in an arm’s length transaction.
Fair value hierarchy
Fair value is defined as the price that would be received to sell an asset or paid to transfer a liability in an orderly
transaction between market participants at the measurement date.
Underlying the definition of fair value is the presumption that the company is a going concern and there is no intention
or requirement to curtail materially the scale of its operations or to undertake a transaction on adverse terms.
A financial instrument is regarded as quoted in an active market if quoted prices are readily and regularly available
from an exchange dealer, broker, industry group, pricing service, or regulatory agency, and those prices represent
actual and regularly occurring market transactions on an arm’s length basis.
IFRS 13 ‘Fair Value Measurement’ requires the company to classify fair value measurements and fair value hierarchy that
reflects the significance of the inputs used in making the measurements of fair value hierarchy has the following levels:
Level 1 : Fair value measurements using quoted (unadjusted) in active markets for identical asset or liability.
Level 2 : Fair value measurements using inputs other than quoted prices included within Level 1 that are observable
for the asset or liability, either directly (i.e. as prices) or indirectly (i.e. derived from prices).
Level 3 : Fair value measurements using inputs for the asset or liability that are not based on observable market data
(i.e. unobservable inputs).
Transfer between levels of the fair value hierarchy are recognized at the end of the reporting period during which the
changes have occurred.
The following table shows the carrying amounts and fair values of financial assets and financial liabilities, including
their levels in the fair value hierarchy. It does not include fair value information for financial assets and financial
liabilities not measured at fair value if the carrying amount is a reasonable approximation of fair value.
269