Page 61 - SustainabilityReport2017
P. 61

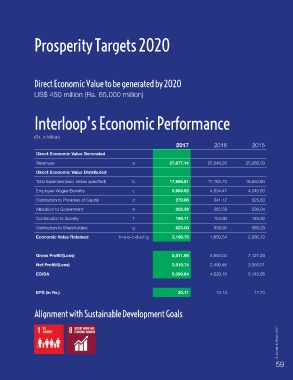
Prosperity Targets 2020


               Direct Economic Value to be generated by 2020


               US$ 450 million (Rs. 65,000 million)


               Interloop’s Economic Performance


               (Rs. In Million)
                                                                           2017           2016            2015
                Direct Economic Value Generated

                Revenues                                a               27,877.14       25,546.28       25,268.59
                Direct Economic Value Distributed

                Total Expenses (excl. below specified)  b               17,665.81       17,162.73       16,552.60
                Employee Wages/Benefits                 c                5,668.62        4,834.47        4,045.80
                Distribution to Providers of Capital    d                  270.86          341.12          625.83

                Allocation to Government                e                  252.39          562.59          539.04
                Contribution to Society                  f                 199.71          154.90          149.32

                Distribution to Shareholders            g                  623.00          839.93          669.29
                Economic Value Retained            h=a-b-c-d-e-f-g       3,196.75        1,650.54        2,686.72


                Gross Profit/(Loss)                                      5,811.95        5,853.03        7,127.49
                Net Profit/(Loss)                                        3,819.74        2,490.46        3,356.01

                EBIDA                                                    5,399.84        4,020.16        5,143.85


                EPS (in Rs.)                                                20.11           13.14           17.70


               Alignment with Sustainable Development Goals


                                                                                                                     Sustainability Report 2017


                                                                                                                    59
   56   57   58   59   60   61   62   63   64   65   66