Page 56 - Interloop Sustainability Report 2019
P. 56

USING RESOURCES                                                                                                               REDUCING


            EFFICIENTLY AND RESPONSIBLY                                                                                                   EMISSIONS AND WASTES


            Water Usage                      investing in initiatives for recycling and   During the year, different initiatives were     GHG Emissions                    and continuous upgradation of    greenhouse gas emissions at our
                                             reuse of processing water.       taken for efficient utilization of water in                                                  operations. These emissions are   production units to ensure compliance
            Water is an important resource for the                            the production facilities and reduction                     Greenhouse gas emissions are     the result of multiple operational   with control limits as well as meeting
            textile industry. It is extensively used in   Interloop withdraws ground water for   of fresh water intake, supporting        major cause of climate change and   processes and subject to limits set by   the targets set in these areas as part of
            textile processing operations including   consumption in its operations. The   SDG 6; Clean Water and Sanitation.             cannot be completely avoided.    Environmental Protection Agency (EPA)   our five-year plan.
            dyeing, resizing, scouring, bleaching   area has been declared as high risk   The initiatives include water reuse in          However, measures can be taken to   under Punjab Environmental Quality
            and mercerizing. Interloop uses water   according to WRI aqua duct tool. As   socks processing, installation of water         reduce the GHG emissions through   Standards (PEQs). We regularly monitor
            in hosiery as well as yarn dyeing apart   water table is shallow, hence, mineral   efficient Nano bubble technology in        introduction of cleaner technologies
            from producing steam. We are focused   contamination is more in the area.   wash process, water saving taps in
            on reducing water consumption in   However, the size of the water source   canteen areas and re-utilization of                                               Unit                  FY 2019           FY 2018           FY 2017
            our operations by using dyes which   is not known. The water source is not   ablution water in the mosques.                    GHG Emissions                  Mt                    68,579           123,196             78,447
            require less water, and installation of   declared as protected area, however,
            water efficient equipment. We are also   it is significantly important for the                                                CO , CH , N O gases are included in the calculation of CO e emissions. No biogenic emissions occur at Interloop. The source
                                             community dependent on this source.                                                            2   4  2                                   2
                                                                                                                                          of emission factors were derived from IPCC’s 5  assessment report.
                                                                                                                                                                              th
             Water withdrawal by source      Unit                 FY 2019           FY 2018          FY 2017                                                             Unit                  FY 2019           FY 2018           FY 2017
             Ground water                     m 3                2,667,672         2,971,045         3,283,288                             Reduction in GHG Emissions
                                                                                                                                           through multiple initiatives   Mt                     9,090            16,181              8,687
            The water withdrawal is measured through flow meters.
                                                                                                                                          Only scope - I emissions resulting from CO , CH , N O gases are included in the calculation.
            Initiatives for Efficient                                                                                                                                      2   4  2
            Water Management
                                                                                                                                                      GHG Emissions                                  Reduction in GHG Emissions
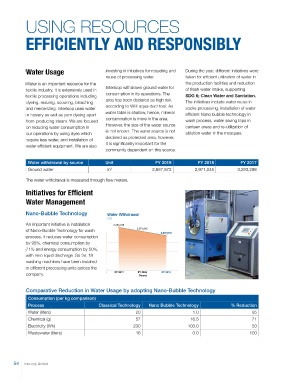
            Nano-Bubble Technology            Water Withdrawal                                                                                        (Mt)                                           (Mt)
                                              (m ) 3                                                                                                               123,196                                        16,181
            An important initiative is installation   3,283,288
            of Nano-Bubble Technology for wash            2,971,045
                                                                    2,667,672                                                                            78,447
            process. It reduces water consumption                                                                                                                             68,579                    8,687               9,090
            by 95%, chemical consumption by
            71% and energy consumption by 50%,
            with zero liquid discharge. So far, 18
            washing machines have been installed
                                                                                                                                                          FY 2017  FY 2018   FY 2019                    FY 2017  FY 2018   FY 2019
            in different processing units across the                                                                                                                (Years)                                       (Years)
            company.                             FY 2017   FY 2018  FY 2019
                                                           (Years)

            Comparative Reduction in Water Usage by adopting Nano-Bubble Technology
             Consumption (per kg comparison)
             Process                       Classical Technology   Nano Bubble Technology         % Reduction
             Water (liters)                               20                     1.0                      95
             Chemical (g)                                 57                     16.5                     71
             Electricity (Wh)                            200                    103.0                     50
             Wastewater (liters)                          18                      0.0                    100


       54  Interloop Limited                                                                                                                                                                                                Sustainability Report 2019  55
   51   52   53   54   55   56   57   58   59   60   61