
Page 215 - Interloop Annual Report 2018-2019
P. 215
NOTES TO THE CONSOLIDATED NOTES TO THE CONSOLIDATED
FINANCIAL STATEMENTS FINANCIAL STATEMENTS
FOR THE YEAR ENDED JUNE 30, 2019 FOR THE YEAR ENDED JUNE 30, 2019
2019 2018
Note Rupees in ‘000
29.1 These are secured against first Joint Pari Passu (JPP) charge of Rs. 27,351.83 million (2018: 26,083.33 million), ranking charge of Rs. 2,632 million
(2018: Nil) by all the lending banks over all present and future current assets of the Company and lien over import/export documents. The total limits
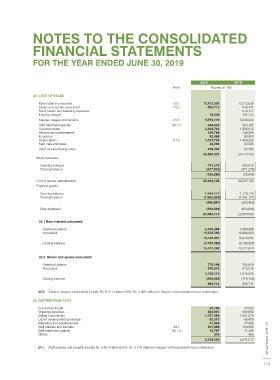
available to the Company for short term borrowings from all the banks are amounting to Rs. 25,250 million (2018: 19,562.5 million). 33. COST OF SALES
Mark up is charged as; Raw material consumed 33.1 15,707,302 13,312,629
Stores and spares consumed 33.2 859,712 836,747
Feed, health and breeding expenses - 674,172
ERF - II SBP rate + 0.25 to 0.30% p.a (2018: SBP rate + 0.25% to 0.40% p.a).
Knitting charges 18,930 192,135
FAPC - own source 3 months Kibor + 0.25 to 0.50% p.a (2018: 3 to 6 months Kibor + 0.25 to 1.00% p.a) Salaries, wages and benefits 33.3 5,574,179 5,068,623
Staff retirement gratuity 26.1.4 444,633 354,187
Running finance 1 to 3 months Kibor + 0.20 to 1.00% p.a (2018: 1 to 3 months Kibor + 0.20 to 1.00% p.a) Fuel and power 2,264,744 1,926,612
Repairs and maintenance 129,769 144,389
2019 2018 Insurance 52,485 85,903
Note Rupees in ‘000 Depreciation 8.1.2 1,497,725 1,404,282
Rent, rate and taxes 32,900 32,305
30. CURRENT PORTION OF NON CURRENT LIABILITIES Other manufacturing costs 238,042 85,766
Long term financing 24 1,247,191 968,540 26,820,421 24,117,750
Liabilities against assets subject to finance lease 25 - 470
Work in process
1,247,191 969,010
Opening balance 471,276 450,678
Closing balance (597,562) (471,276)
31. CONTINGENCIES AND COMMITMENTS
(126,286) (20,598)
31.1 Contingencies
Cost of goods manufactured 26,694,135 24,097,152
31.1.1 Bank guarantees issued by various banks on behalf of the company in favour of: Finished goods
Sui Northern Gas Pipelines limited against supply of gas. 547,069 386,804 Opening balance 1,484,177 1,120,718
Closing balance (1,965,058) (1,484,177)
The Director, Excise and Taxation, Karachi against imposition of infrastructure cess 198,853 172,853 (480,881) (363,459)
Faisalabad Electric Supply Company (FESCO) against supply of electricity. 70,414 70,414 Duty drawback (569,539) (850,604)
25,643,715 22,883,089
Punjab Revenue Authority 8,033 4,335
33.1 Raw material consumed
State Bank of Pakistan 127,551 25,000
Opening balance 3,166,265 1,994,485
951,920 659,406 Purchases 16,276,392 14,484,409
31.1.2 Post dated cheques issued in favour of custom authorities for release of imported 3,291,613 2,643,166 19,442,657 16,478,894
goods Closing balance (3,735,355) (3,166,265)
15,707,302 13,312,629
31.3 Commitments
Under letters of credit for: 33.2 Stores and spares consumed
Capital expenditure 1,275,725 747,706 Opening balance 779,198 702,029
Raw material 109,974 209,206 Purchases 970,918 913,916
Stores and spares 136,399 37,153 1,750,116 1,615,945
1,522,098 994,065 Closing balance (890,404) (779,198)
859,712 836,747
32. SALES - NET
33.3 Salaries, wages and benefits include Rs. 6.321 million (2018: Rs. 5.489 million) in respect of the provident fund contribution.
Export sales 32.1 33,978,768 27,518,696
Local sales 3,770,209 4,850,087
34. DISTRIBUTION COST
Gross sales 37,748,977 32,368,783
Sea and air freight 50,165 47,672
Less: Shipping expenses 623,897 660,682
Sales discount (206,793) (206,052) Selling commission 1,757,956 1,621,212
Sales tax (31,122) (20,773) Export development surcharge 83,310 66,600
Marketing and advertisement 61,492 77,900
(237,915) (226,825)
34.1
Staff salaries and benefits 26.1.4 201,868 154,966 2018 - 19
14,787
11,498
Staff retirement gratuity
32,141,958
37,511,062
Interloop Limited 32.1 It includes exchange gain amounting to Rs. 2,259.977 million (2018: Rs. 890.620 million). 34.1 Staff salaries and benefits include Rs. 0.961 million (2018: Rs. 0.715 million) in respect of the provident fund contribution. 2,641,013 Annual Report
483
918
Others
2,794,393
212 213