Page 64 - Interloop Annual Report 2018-2019
P. 64

KEY FINANCIAL RATIOS                                                                                                          GRAPHICAL REPRESENTATION


                                                                                                                                          OF RATIOS


                                                                                                                                          OUR PERFORMANCE OVER THE YEAR


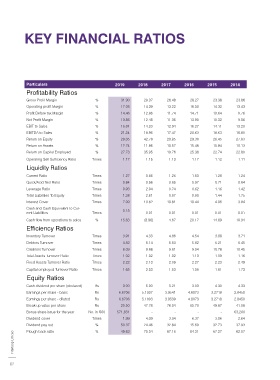
             Particulars                           2019      2018       2017      2016      2015      2014                                Gross Profit                                                   Gross Profit Margin
             Profitability Ratios                                                                                                         On account  of effective management and prompt decision   40.00
                                                                                                                                          making, the company has been performing steadily over the last   30.00                29.37  31.90
             Gross Profit Margin           %          31.90      29.37     26.48     28.27     23.38     23.86                            six years. The impact of increased sales volume, coupled with cost   23.86  23.38  28.27  26.48
             Operating profit Margin       %          17.08      14.39     13.22     16.50     14.32     13.43                            efficiencies, better sales mix and operational improvements resulted   20.00
                                                                                                                                          in ever highest gross profit of PKR 11,954 Million as compared to
             Profit Before tax Margin      %          14.46      12.86     11.74     14.71     10.64      9.76                                                                               10.00
                                                                                                                                          PKR 5,404 Million in 2014.  Consequentially, compound annual
             Net Profit Margin             %          13.86      12.48     11.35     13.90     10.32      9.56                            growth rate ‘CAGR’ of gross profit rate reached 17.2% over the past   0
             EBIT to Sales                 %          16.84      14.20     12.94     16.27     14.11     13.20                            Six years.                                               2014   2015    2016   2017   2018   2019
             EBITDA to Sales               %          21.24      18.96     17.47     20.63     18.63     16.80
             Return on Equity              %          29.05      42.78     20.85     29.39     26.45     27.83                            Net Profit Margin and Return                              Net Profit Margin and Return
             Return on Assets              %          12.74      11.86     10.57     15.48     10.84     10.13                            on Equity & Assets                                 50.00       on Equity & Assets
             Return on Capital Employed    %          27.73      35.95     19.76     25.38     22.74     22.80                                                                               40.00                              42.78
             Operating Self Sufficiency Ratio  Times   1.17      1.15      1.13       1.17      1.12      1.11                            Net Profit Margin                                  30.00   27.83    26.45    29.39    20.85    29.05
                                                                                                                                                                                             20.00              13.90    15.48   11.35    12.48    11.86   13.86    12.74
             Liquidity Ratios                                                                                                             A strong topline along with effective cost management has allowed   10.00   9.56    10.13   10.32    10.84    10.57
                                                                                                                                          us to reach the highest ever profit after tax of PKR 5,194 Million as   0
             Current Ratio               Times         1.27      0.86      1.26       1.53      1.28      1.24                            compared to PKR 2,166 Million yielding a CAGR of 19.1 % over the   2014  2015  2016  2017  2018  2019
             Quick/Acid Test Ratio       Times         0.84      0.56      0.85       0.97      0.71      0.64                            last Six years.                                      Net Profit Margin %  Return on Equity %  Return on Assets %
             Leverage Ratio              Times         0.93      2.04      0.74       0.62      1.16      1.42                            Return on Equity & Assets
             Total Liabilities To Equity  Times        1.28      2.61      0.97       0.90      1.44      1.75                                                                                             Liquidity Ratios
             Interest Cover              Times         7.09      10.62     10.81     10.44      4.06      3.84                            The Company continuously monitors its capital structure and aims   2.00
                                                                                                                                          to keep it at its optimum level. Strong growth and optimal capital     1.53
             Cash and Cash Equivalent to Cur-          0.15                                                                               structure has enable the company to reap higher return on equity   1.50  1.24  1.28  1.26   1.27
             rent Liabilities            Times                   0.01      0.01       0.01      0.01      0.01                            and assets. For FY 2019, the return on equity and return on assets   1.00   0.97
             Cash flow from operations to sales  %    15.63     (8.96)     4.67      20.17    14.69      10.94                            recorded at 29.05% and 12.7 % respectively.                0.64    0.71         0.85   0.86   0.56    0.84
                                                                                                                                                                                             0.50
             Efficiency Ratios                                                                                                            Liquidity Ratios
             Inventory Turnover          Times         3.91      4.33      4.86       4.54      3.88      3.71                                                                                 0  2014    2015   2016   2017    2018  2019
                                                                                                                                          By devising strong cash and working capital management policies
             Debtors Turnover            Times         4.82      5.14      5.53       5.82      6.21      6.45
                                                                                                                                          over the years, liquidity of the company is in stable position.  Current Ratio Times  Quick/Acid Test Ratio Times
             Creditors Turnover          Times         8.09      9.68      9.81       9.94     10.78     10.45
             Total Assets Turnover Ratio  Times        1.02      1.02      1.02       1.13      1.09      1.16                            Activity/Turnover                                                     Activity
             Fixed Assets Turnover Ratio  Times        2.22      2.13      2.09       2.27      2.23      2.49                                                                               15.00
                                                                                                                                          The inventory turnover of the company witnessed a healthy trend
             Capital employed Turnover Ratio  Times    1.65      2.53      1.53       1.56      1.61      1.73                            as the company strives to implement more effective inventory   10.00   10.45    10.78    9.94    9.81    9.68    8.09
             Equity Ratios                                                                                                                management. To remain competitive in the market and to gain   5.00   3.71    6.45    3.88    6.21    4.54    5.82    4.86    5.53    4.33   5.14   3.91    4.82
                                                                                                                                          market share,  the company extends credit to its customers keeping
             Cash dividend per share (declared)  Rs    3.00      5.00      5.21       3.03      4.30      4.33                            in view the credit worthiness of the customer. Company tends to pay   0
                                                                                                                                          to its supplier in a timely manner, in order to ensure smooth supply
             Earnings per share - basic   Rs          6.6706    5.1007    3.9541    4.8073    3.2718    2.8450                            of goods and services.                                   2014   2015   2016   2017   2018   2019
             Earnings per share - diluted  Rs         6.6706    5.1003    3.9539    4.8073    3.2718    2.8450                                                                                 Inventory Turnover Times  Creditors Turnover Times  Debtors Turnover Times
             Break up value per share     Rs          20.50      47.78     76.04     65.70     49.67     41.06                            Earning per Share
             Bonus share issue for the year  No. in '000  571,831    -        -         -         -      63,200                                                                                           Earnigs per share
                                                                                                                                          Effective management of controllable factors has allowed company   8.0000
             Dividend cover              Times         1.99      4.09      3.04       6.37      3.06      2.64                            to reach highest ever Earning Per Share of PKR 6.76. The healthy                              6.6706
             Dividend pay out              %          50.37      24.46     32.84     15.69     32.73     37.93                            growth in  earning per  share provides a  strong financial base for   6.0000   2.8450    3.2718    4.8073    3.9541    5.1007   2018 - 19
                                                                                                                                                                                             4.0000
                                                                                                                                          supporting the implementation of the Company’s growth strategy.
                                                                 75.54
                                                      49.63
                                                                           67.16
                                           %
             Plough back ratio
                                                                                                         62.07
                                                                                     84.31
                                                                                               67.27
       Interloop Limited                                                                                                                                                                     2.0000 0  2014  2015  2016  2017   2018   2019      Annual Report
     62                                                                                                                                                                                                                                        63
   59   60   61   62   63   64   65   66   67   68   69