
Page 69 - Interloop Annual Report 2018-2019
P. 69
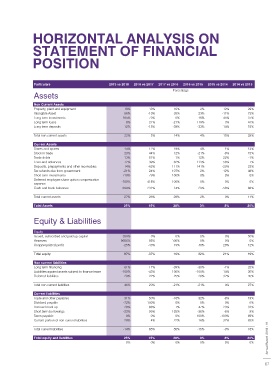
LAST SIX YEARS STATEMENT OF   HORIZONTAL ANALYSIS ON


 FINANCIAL POSITION  STATEMENT OF FINANCIAL

               POSITION


 Particulars  2019  2018  2017  2016  2015  2014  Particulars  2019 vs 2018  2018 vs 2017  2017 vs 2016  2016 vs 2015  2015 vs 2014  2014 vs 2013
 Rupees in ‘000                                                              Percentage
 Assets         Assets

                Non Current Assets
 Non Current Assets  Property, plant and equipment     18%        13%        16%         2%        12%       29%
 Property, plant and equipment   18,256,474    15,451,969    13,639,799    11,710,739    11,443,616    10,196,342   Intangible Asset  56%  -10%  35%  23%  -11%  73%
 Intangible Asset   66,161    42,410    47,205    34,923    28,356    31,792   Long term investments  165%  -73%  0%  16%  45%  37%
 Long term investments   1,008,735    380,549    1,400,159    1,400,159    1,204,452    830,087   Long term loans  8%  21%  -21%  119%  3%  41%
 Long term loans   65,762    60,747    50,027    63,227    28,853    28,132   Long term deposits  12%  -15%  -39%  -33%  14%  15%
 Long term deposits   28,019    25,055    29,372    48,356    71,870    62,945
                Total non current assets               22%         5%        14%         4%        15%       29%
 Total non current assets   19,425,151    15,960,730    15,166,563    13,257,404    12,777,147    11,149,298
                Current Assets
 Current Assets  Stores and spares                     14%        12%        19%         4%        1%        13%
 Stores and spares   887,659    779,198    696,743    583,261    559,983    556,955   Stock in trade  23%  44%  12%  -21%  -9%  15%
 Stock in trade   6,282,491    5,121,718    3,565,881    3,176,741    4,005,721    4,422,082   Trade debts  13%  51%  1%  12%  22%  -1%
 Trade debts   8,247,740    7,293,008    4,814,220    4,778,114    4,277,049    3,501,181   Loan and advances  72%  -39%  62%  113%  -58%  7%
 Loan and advances   1,063,342    617,743    1,007,837    621,987    292,616    702,803   Deposits, prepayments and other receivables  14%  -63%  111%  141%  -20%  22%
 Deposits, prepayments and other receivables   204,985    179,864    480,505    227,858    94,516    118,055   Tax refunds due from government  -21%  24%  107%  2%  12%  48%
 Tax refunds due from government   1,925,439    2,451,806    1,971,626    952,073    930,589    827,858   Short term investments  719%  -79%  100%  0%  0%  0%
 Short term investments   1,207,251    147,425    716,526    -      -      -     Deferred employee share option compensation
 Deferred employee share option compensation    -      5,014    968    -      -      -     expense  -100%  418%  100%  0%  0%  0%
 expense        Cash and bank balances                 694%      231%        14%        20%       -56%       88%
 Cash and bank balances   1,538,564    193,687    58,599    51,374    42,660    96,408
                Total current assets                   27%        26%        28%         2%        0%        11%
 Total current assets   21,357,471    16,789,463    13,312,905    10,391,408    10,203,134    10,225,343
                Total Assets                           25%        15%        20%        3%         8%        20%
 Total Assets   40,782,622    32,750,193    28,479,468    23,648,813    22,980,281    21,374,641
 Equaty & Liabilities  Equity & Liabilities


 Equity         Equity
 Issued, subscribed and paid up capital   8,721,975    1,901,104    1,899,385    1,896,000    1,896,000    1,896,000   Issued, subscribed and paid up capital  359%  0%  0%  0%  0%  50%
 Reserves   3,791,602    38,863    21,052    -      -      -     Reserves  9656%  85%  100%  0%    0%         0%
 Unappropriated profit   5,366,207    7,142,570    12,522,990    10,560,457    7,522,173    5,889,245   Unappropriated profit  -25%  -43%  19%  40%  28%  12%
 Total equity   17,879,784    9,082,537    14,443,427    12,456,457    9,418,173    7,785,245
                Total equity                           97%        -37%       16%        32%       21%        19%
 Non current liabilities  Non current liabilities
 Long term financing   3,628,745    2,247,936    1,916,475    3,133,871    4,451,888    4,486,997   Long term financing  61%  17%  -39%  -30%  -1%  25%
 Liabilities against assets subject to finance lease   -      615    1,084    -      146,080    128,360   Liabilities against assets subject to finance lease  -100%  -43%  100%  -100%  14%  30%
 Deferred liabilities   2,482,623    1,925,612    1,572,461    1,262,174    984,358    746,857   Deferred liabilities  29%  22%  25%  28%  32%  45%

 Total non current liabilities   6,111,368    4,174,163    3,490,020    4,396,045    5,582,326    5,362,214   Total non current liabilities  46%  20%  -21%  -21%  4%  27%
 Current liabilities  Current liabilities
 Trade and other payables   3,576,861    2,730,414    1,815,056    2,159,892    1,641,861    1,790,580   Trade and other payables  31%  50%  -16%  32%  -8%  19%
 Dividend payable   130,935    475,276    -      -      -      -     Dividend payable  -72%  100%  0%  0%  0%  0%
 Accrued mark up    110,483    137,856    83,140    88,958    166,495    214,844   Accrued mark up   -20%  66%  -7%  -47%  -23%  31%
 Short term borrowings   11,726,000    15,180,937    7,636,573    3,255,000    5,055,000    5,360,000   Short term borrowings  -23%  99%  135%  -36%  -6%  9%
 Taxes payable   -      -      -      -      -      13,726   Taxes payable  0%  0%  0%  100%     -100%       89%
 Current portion of non current liabilities   1,247,191    969,010    1,011,252    1,292,461    1,116,426    848,032   Current portion of non current liabilities  29%  -4%  -22%  16%  32%  83%

 Total current liabilities   16,791,470    19,493,493    10,546,021    6,796,310    7,979,782    8,227,182   Total current liabilities  -14%  85%  55%  -15%  -3%  16%  2018 - 19
 Interloop Limited  Total equity and liabilities   40,782,622    32,750,193    28,479,468    23,648,813    22,980,281    21,374,641   Total equity and liabilities  25%  15%  20%  3%  8%  20%  Annual Report
  -
  -
  -
  -
  -
  -
                                                                              0%
                                                                                         0%
                                                                                                   0%
                                                                                                              0%
                                                         0%
                                                                   0%
 66                                                                                                                  67