
Page 67 - Interloop Annual Report 2018-2019
P. 67
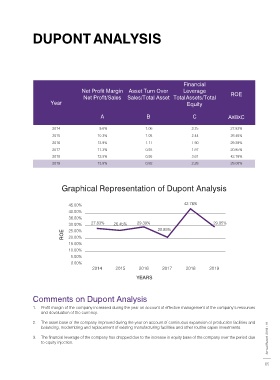
DUPONT CHART         DUPONT ANALYSIS


 For the year ended June 30, 2019                                  Rupees in ï000


                                                                                 Financial
                                     Net Profit Margin   Asset Turn Over         Leverage             ROE
                                      Net Profit/Sales   Sales/Total Asset Total Assets/Total
                       Year                                                        Equity


                                             A                   B                   C               AxBxC
 Return on Equity
 29.05%                 2014                  9.6%               1.06                2.75             27.83%
                        2015                10.3%                1.05                2.44             26.45%
                        2016                13.9%                1.11                1.90             29.39%
                        2017                11.3%                0.93                1.97             20.85%
                        2018                12.5%                0.95                3.61             42.78%
 Multiply
 Financial   Return on  2019                13.9%                0.92                2.28             29.05%
 Leverage  Assets
 2.28 Times  12.74%


                            Graphical Representation of Dupont Analysis

 Divide
 Multiply
 Share Capital   Total Assets  Assets  Net Profit                                42.78%
 & Reserves  Turnover  Margin  45.00%
 17,879,784  40,782,622  0.92 Times  13.86%  40.00%
                               36.00%
                               30.00%    27.83%    26.45%    29.39%   20.85%                  29.05%
                             ROE  25.00%
 Add
                               20.00%
 Divide
 Divide
 Total  Share Capital  Total Assets  Net Sales  Net Profit
  Liabilities   & Reserves  40,782,622  37,478,321  5,194,767  15.00%
 22,902,838  17,879,784        10.00%
                                5.00%
                                0.00%
                                         2014       2015      2016      2017      2018       2019
 Add
 Add
 Less
                                                             YEARS
 Current  Non-Current   Non-Current  Current Assets  Total Costs  Net Sale
  Liabilities  Liabilities   Assets
 16,791,470  6,111,368  19,425,151  21,357,471  32,283,554  37,478,321
               Comments on Dupont Analysis
               1.  Profit margin of the company increased during the year on account of effective management of the company’s resources
                   and devaluation of the currency.

               2.  The asset base of the company improved during the year on account of continuous expansion of production facilities and
                   balancing, modernizing and replacement of existing manufacturing facilities and other routine capex investments.  2018 - 19
 Interloop Limited  3.  The financial leverage of the company has dropped due to the increase in equity base of the company over the period due   Annual Report
                   to equity injection.


 64                                                                                                                  65