
Page 73 - InterloopAnnualReport2021
P. 73
KEY FINANCIAL RATIOS LAST SIX YEARS
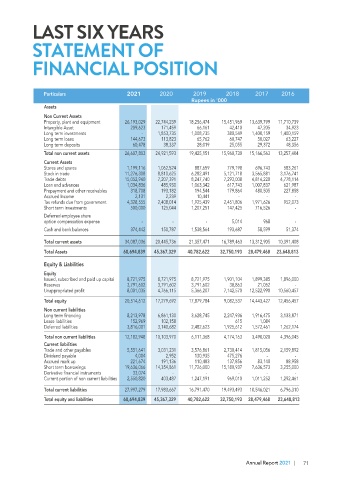
STATEMENT OF
FINANCIAL POSITION
Particulars 2021 2020 2019 2018 2017 2016 Particulars 2021 2020 2019 2018 2017 2016
Rupees in '000
Profitability Ratios Assets
Non Current Assets
Gross Profit Margin % 25.86 21.66 31.90 29.37 26.48 28.27
Property, plant and equipment 26,193,029 22,744,239 18,256,474 15,451,969 13,639,799 11,710,739
Net Profit Margin % 11.45 4.95 13.86 12.48 11.35 13.90 Intangible Asset 209,623 171,459 66,161 42,410 47,205 34,923
Long term investments - 1,853,735 1,008,735 380,549 1,400,159 1,400,159
Return on Equity % 30.67 10.40 29.05 42.78 20.85 29.39 Long term loans 144,673 113,823 65,762 60,747 50,027 63,227
Long term deposits 60,478 38,337 28,019 25,055 29,372 48,356
Total non current assets 26,607,803 24,921,593 19,425,151 15,960,730 15,166,563 13,257,404
Liquidity Ratios
Current Assets
Current Ratio Times 1.22 1.14 1.27 0.86 1.26 1.53 Stores and spares 1,199,116 1,062,524 887,659 779,198 696,743 583,261
Stock in trade 11,276,308 8,810,625 6,282,491 5,121,718 3,565,881 3,176,741
Quick/Acid Test Ratio Times 0.77 0.59 0.84 0.56 0.85 0.97
Trade debts 15,052,940 7,207,391 8,247,740 7,293,008 4,814,220 4,778,114
Loan and advances 1,034,836 485,930 1,063,342 617,743 1,007,837 621,987
Prepayment and other receivables 318,708 193,182 194,544 179,864 480,505 227,858
Investment/Market Ratios Accrued Income 2,131 2,239 10,441 - - -
Tax refunds due from government 4,328,555 2,408,014 1,925,439 2,451,806 1,971,626 952,073
Earnings per share - basic Rs 7.21 2.06 6.67 5.10 3.95 4.81 Short term investments 500,000 125,044 1,207,251 147,425 716,526 -
Earnings per share - diluted Rs 7.21 2.06 6.67 5.10 3.95 4.81 Deferred employee share
option compensation expense - - - 5,014 968 -
Dividend Yield Ratio % 3.57 4.55 6.78 - - -
Cash and bank balances 374,442 150,787 1,538,564 193,687 58,599 51,374
Cash dividend per share - declared Rs 2.50 2.00 3.00 5.00 5.21 3.03
Total current assets 34,087,036 20,445,736 21,357,471 16,789,463 13,312,905 10,391,408
Market Price - at year end Rs 70.03 43.92 44.27 - - -
Total Assets 60,694,839 45,367,329 40,782,622 32,750,193 28,479,468 23,648,813
Break up value per share Rs 23.52 19.81 20.50 47.78 76.04 65.70
Equity & Liabilities
Capital Structure Equity
Issued, subscribed and paid up capital 8,721,975 8,721,975 8,721,975 1,901,104 1,899,385 1,896,000
Leverage Ratio Times 1.50 1.27 0.93 2.04 0.74 0.62 Reserves 3,791,602 3,791,602 3,791,602 38,863 21,052 -
Unappropriated profit 8,001,035 4,766,115 5,366,207 7,142,570 12,522,990 10,560,457
Interest Cover Times 8.29 3.15 7.09 10.62 10.81 10.44
Operating Cycle Days 135.56 144.66 124.04 117.58 103.86 106.47 Total equity 20,514,612 17,279,692 17,879,784 9,082,537 14,443,427 12,456,457
Non current liabilities
Long term financing 8,213,978 6,861,130 3,628,745 2,247,936 1,916,475 3,133,871
Lease liabilities 152,969 102,158 - 615 1,084 -
Deferred liabilities 3,816,001 3,140,682 2,482,623 1,925,612 1,572,461 1,262,174
Total non current liabilities 12,182,948 10,103,970 6,111,368 4,174,163 3,490,020 4,396,045
Current liabilities
Trade and other payables 5,551,641 3,031,231 3,576,861 2,730,414 1,815,056 2,159,892
Dividend payable 4,004 2,952 130,935 475,276 - -
Accrued mark up 221,674 191,136 110,483 137,856 83,140 88,958
Short term borrowings 19,636,066 14,354,861 11,726,000 15,180,937 7,636,573 3,255,000
Derivative financial instruments 33,074 - - - - -
Current portion of non current liabilities 2,550,820 403,487 1,247,191 969,010 1,011,252 1,292,461
Total current liabilities 27,997,279 17,983,667 16,791,470 19,493,493 10,546,021 6,796,310
Total equity and liabilities 60,694,839 45,367,329 40,782,622 32,750,193 28,479,468 23,648,813
Annual Report 2021 | 71