
Page 77 - InterloopAnnualReport2021
P. 77
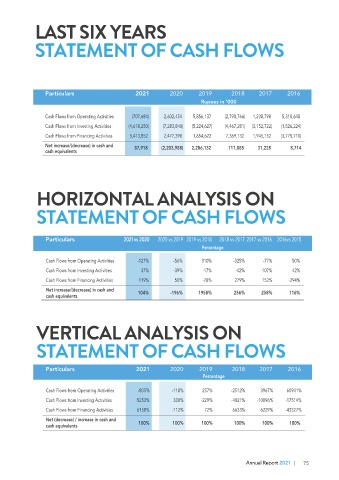
LAST SIX YEARS  LAST SIX YEARS


 STATEMENT OF PROFIT OR LOSS  STATEMENT OF CASH FLOWS


    Particulars   2021   2020  2019  2018  2017  2016     Particulars   2021   2020  2019  2018  2017  2016

                                         Rupees in '000
                                                                        Rupees in '000

    Sales - net    54,962,265     36,302,794     37,478,321     31,138,736    26,529,786    26,333,359
                 Cash Flows from Operating Activities    (707,684)    2,602,454     5,856,137     (2,790,766)    1,238,798     5,310,648
    Gross Profit    14,212,280     7,863,718     11,954,714     9,144,499    7,026,284     7,445,009
                 Cash Flows from Investing Activities    (4,618,250)    (7,283,840)    (5,224,627)    (4,467,281)   (3,152,722)    (1,526,224)
    Operating expenses    (6,192,379)    (4,610,725)    (5,538,024)    (4,655,082)    (3,520,071)    (3,097,516)
                 Cash Flows from Financing Activities     5,413,852     2,477,398     1,654,622     7,369,132     1,945,152     (3,775,710)
    Profit from operations  8,019,901     3,252,993     6,416,690     4,489,417    3,506,213     4,347,493

    Finance cost    (1,147,038)    (1,137,162)    (995,707)    (483,654)    (391,940)    (472,972)      Net increase/(decrease) in cash and      87,918     (2,203,988)    2,286,132     111,085     31,228     8,714
                 cash equivalents
    Profit before taxation    6,872,863     2,115,831     5,420,983     4,005,763    3,114,273     3,874,521

    Taxation    (581,292)    (319,428)    (226,216)    (119,954)    (103,188)    (214,117)

    Profit for the year    6,291,571     1,796,403     5,194,767     3,885,809    3,011,085     3,660,404
 HORIZONTAL ANALYSIS ON  HORIZONTAL ANALYSIS ON


 STATEMENT OF PROFIT OR LOSS  STATEMENT OF CASH FLOWS


    Particulars   2021vs 2020   2020 vs 2019  2019 vs 2018   2018 vs 2017 2017 vs 2016  2016vs 2015     Particulars   2021vs 2020   2020 vs 2019  2019 vs 2018   2018 vs 2017 2017 vs 2016  2016vs 2015

 Percentage
                                                                        Percentage

    Sales - net   51%   -3%   20%   17%  1%  9%
                 Cash Flows from Operating Activities   -127%   -56%    310%       -325%     -77%       50%
    Gross Profit   81%   -34%   31%   30%   -6%   32%
                 Cash Flows from Investing Activities   37%   -39%      -17%        -42%     -107%      42%
    Operating expenses   34%  -17%  19%  32%  14%  42%
                 Cash Flows from Financing Activities    119%   50%     -78%       279%      152%     -294%
    Profit from operations   147%   -49%   43%   28%   -19%   26%
    Finance cost   1%   14%   106%   23%  -17%  -47%     Net increase/(decrease) in cash and
                 cash equivalents                104%        -196%     1958%       256%      258%      116%
    Profit before taxation   225%   -61%   35%   29%   -20%   51%
 Taxation  82%  41%  89%  16%  -52%  175%

    Profit for the year   250%   -65%   34%   29%   -18%   47%
 VERTICAL ANALYSIS ON   VERTICAL ANALYSIS ON


 STATEMENT OF PROFIT OR LOSS  STATEMENT OF CASH FLOWS


    Particulars   2021   2020  2019  2018  2017  2016     Particulars   2021   2020  2019  2018  2017  2016
                                                                        Percentage

 Percentage

    Sales - net   100%  100%  100%   100%  100%  100%
                 Cash Flows from Operating Activities   -805%   -118%   257%      -2512%     3967%    60941%
    Gross Profit   25.86%   21.66%   31.90%   29.37%   26.48%   28.27%
                 Cash Flows from Investing Activities   -5253%   330%   -229%     -4021%   -10096%   -17514%
    Operating expenses   -11.27%  -12.70%  -14.78%  -14.95%  -13.27%  -11.76%
                 Cash Flows from Financing Activities    6158%   -112%   72%       6633%     6229%   -43327%
    Profit from operations   14.59%   8.96%   17.12%   14.42%   13.22%   16.51%
    Finance cost   -2.09%  -3.13%  -2.66%  -1.55%  -1.48%  -1.80%     Net (decrease) / increase in cash and
                 cash equivalents                 100%        100%      100%       100%      100%      100%
    Profit before taxation   12.50%   5.83%   14.46%   12.86%   11.74%   14.71%
 Taxation  -1.06%  -0.88%  -0.60%  -0.39%  -0.39%  -0.81%

    Profit for the year   11.45%   4.95%   13.86%   12.48%   11.35%   13.90%

                                                                                       Annual Report 2021  |  75