
Page 153 - Interloop Annual Report 2018-2019
P. 153
NOTES TO THE UNCONSOLIDATED NOTES TO THE UNCONSOLIDATED
FINANCIAL STATEMENTS FINANCIAL STATEMENTS
FOR THE YEAR ENDED JUNE 30, 2019 FOR THE YEAR ENDED JUNE 30, 2019
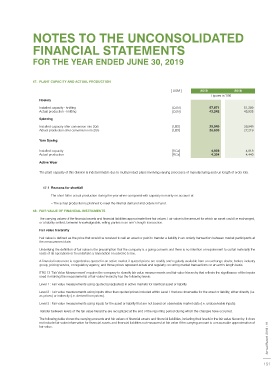
46.2 Reconciliation of reportable segment assets and liabilities 47. PLANT CAPACITY AND ACTUAL PRODUCTION
Hosiery Spinning Others Total Company [ UOM ] 2019 2018
2019 2018 2019 2018 2019 2018 2019 2018 Figures in ‘000
Rupees in ‘000 Rupees in ‘000 Rupees in ‘000 Rupees in ‘000 Hosiery
Installed capacity - knitting [DZN] 57,871 51,289
Total assets for reportable segment 24,711,293 21,629,176 5,261,938 4,933,605 5,101,383 2,983,876 35,074,614 29,546,657 Actual production - knitting [DZN] 43,242 45,935
Unallocated assets: Spinning
Long term investments 1,008,735 380,549 Installed capacity after conversion into 20/s [LBS] 29,949 29,949
Long term deposits 28,019 25,055 Actual production after conversion into 20/s [LBS] 26,630 27,219
Short term investments 1,207,251 147,425
Tax refunds due from Government 1,925,439 2,451,806 Yarn Dyeing
Cash and bank balances 1,538,564 193,687
Other corporate assets - 5,014
5,708,008 3,203,536 Installed capacity [KGs] 4,928 4,818
Actual production [KGs] 4,324 4,440
Total assets as per balance sheet 40,782,622 32,750,193
Active Wear
Total liabilities for reportable 5,646,890 4,535,746 206,537 276,299 336,992 319,257 6,190,419 5,131,302 The plant capacity of this division is indeterminable due to multi product plans involving varying processes of manufacturing and run length of order lots.
segment
Unallocated liabilities:
47.1 Reasons for shortfall
Long term financing 3,628,745 2,247,936
Liabilities against assets subject to The short fall in actual production during the year when compared with capacity is mainly on account of:
finance lease - 615
Short term borrowings 11,726,000 15,180,937 – The actual production is planned to meet the internal demand and orders in hand.
Current portion of non current 1,247,191 969,010
liabilities 48. FAIR VALUE OF FINANCIAL INSTRUMENTS
Accrued mark up 110,483 137,856
16,712,419 18,536,354 The carrying values of the financial assets and financial liabilities approximate their fair values. Fair value is the amount for which an asset could be exchanged,
or a liability settled, between knowledgeable, willing parties in an arm’s length transaction.
Total liabilities as per balance sheet 22,902,838 23,667,656
Fair value hierarchy
46.3 Geographical information Fair value is defined as the price that would be received to sell an asset or paid to transfer a liability in an orderly transaction between market participants at
the measurement date.
46.3.1 The Company’s revenue from external customers by geographical locations is detailed below:
Underlying the definition of fair value is the presumption that the company is a going concern and there is no intention or requirement to curtail materially the
Asia 3,940,407 2,704,548 scale of its operations or to undertake a transaction on adverse terms.
Europe 16,976,208 14,129,141
North America 12,488,901 10,177,458 A financial instrument is regarded as quoted in an active market if quoted prices are readily and regularly available from an exchange dealer, broker, industry
South America 333,885 307,116 group, pricing service, or regulatory agency, and those prices represent actual and regularly occurring market transactions on an arm’s length basis.
Pakistan 3,738,920 3,820,473
37,478,321 31,138,736 IFRS 13 ‘Fair Value Measurement’ requires the company to classify fair value measurements and fair value hierarchy that reflects the significance of the inputs
used in making the measurements of fair value hierarchy has the following levels:
46.3.2 All non-current assets of the Company as at reporting dates are located and operating in Pakistan.
Level 1 : Fair value measurements using quoted (unadjusted) in active markets for identical asset or liability.
46.4 The Company’s revenue is earned from a large mix of customers. Level 2 : Fair value measurements using inputs other than quoted prices included within Level 1 that are observable for the asset or liability, either directly (i.e.
as prices) or indirectly (i.e. derived from prices).
Level 3 : Fair value measurements using inputs for the asset or liability that are not based on observable market data (i.e. unobservable inputs).
Transfer between levels of the fair value hierarchy are recognized at the end of the reporting period during which the changes have occurred.
The following table shows the carrying amounts and fair values of financial assets and financial liabilities, including their levels in the fair value hierarchy. It does
not include fair value information for financial assets and financial liabilities not measured at fair value if the carrying amount is a reasonable approximation of
fair value. 2018 - 19
Interloop Limited Annual Report
150 151