
Page 73 - Interloop Annual Report 2018-2019
P. 73
LAST SIX YEARS STATEMENT VERTICAL ANALYSIS ON
OF PROFIT OR LOSS STATEMENT OF PROFIT OR LOSS
Particulars 2019 2018 2017 2016 2015 2014 Particulars 2019 2018 2017 2016 2015 2014
Rupees in ‘000 Percentage
Sales - net 37,478,321 31,138,736 26,529,786 26,333,359 24,150,149 22,650,094 Sales - net 100% 100% 100% 100% 100% 100%
Cost of Sales (25,523,607) (21,994,237) (19,503,501) (18,888,350) (18,504,372) (17,245,663) Cost of Sales -68.10% -70.63% -73.52% -71.73% -76.62% -76.14%
Gross Profit 11,954,714 9,144,499 7,026,284 7,445,009 5,645,777 5,404,431 Gross Profit 31.90% 29.37% 26.48% 28.27% 23.38% 23.86%
Operating expenses Operating expenses
Distribution Cost (2,783,719) (2,641,013) (2,113,248) (1,478,933) (909,333) (1,232,856) Distribution Cost -7.43% -8.48% -7.97% -5.62% -3.77% -5.44%
Adiminstrative Cost (1,984,209) (1,597,804) (1,298,707) (1,156,927) (981,659) (899,652) Adiminstrative Cost -5.29% -5.13% -4.90% -4.39% -4.06% -3.97%
Other operating expenses (784,540) (425,429) (108,152) (463,324) (296,467) (229,323) Other operating expenses -2.09% -1.37% -0.41% -1.76% -1.23% -1.01%
Other income 14,444 9,164 35 1,667 2,010 1,742 Other income 0.04% 0.03% 0.00% 0.01% 0.01% 0.01%
(5,538,024) (4,655,082) (3,520,071) (3,097,516) (2,185,449) (2,360,088) -14.78% -14.95% -13.27% -11.76% -9.05% -10.42%
Profit from operations 6,416,690 4,489,417 3,506,213 4,347,493 3,460,328 3,044,343 Profit from operations 17.12% 14.42% 13.22% 16.51% 14.33% 13.44%
Finance cost (995,707) (483,654) (391,940) (472,972) (891,231) (832,644) Finance cost -2.66% -1.55% -1.48% -1.80% -3.69% -3.68%
Profit before taxation 5,420,983 4,005,763 3,114,273 3,874,521 2,569,098 2,211,699 Profit before taxation 14.46% 12.86% 11.74% 14.71% 10.64% 9.76%
Taxation (226,216) (119,954) (103,188) (214,117) (77,827) (45,412) Taxation -0.60% -0.39% -0.39% -0.81% -0.32% -0.20%
Profit after taxation 5,194,767 3,885,809 3,011,085 3,660,404 2,491,270 2,166,287 Profit after taxation 13.86% 12.48% 11.35% 13.90% 10.32% 9.56%
HORIZONTAL ANALYSIS ON STATEMENT OF PROFIT COMMENTARY ON ANALYSIS OF STATEMENT OF
OR LOSS PROFIT OR LOSS
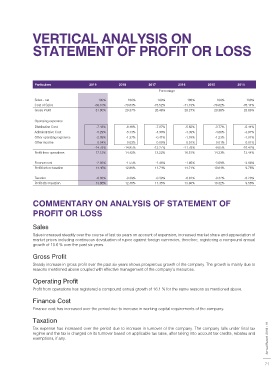
Sales
Particulars 2019 vs 2018 2018 vs 2017 2017 vs 2016 2016 vs 2015 2015 vs 2014 2014 vs 2013
Percentage Sales increased steadily over the course of last six years on account of expansion, increased market share and appreciation of
market prices including continuous devaluation of rupee against foreign currencies, therefore, registering a compound annual
Sales net 204% 17% 1% 9% 7% 21% growth of 10.6 % over the past six years.
Cost of Sales 16% 13% 3% 2% 7% 23%
Gross Profit 31% 30% -6% 32% 4% 14%
Gross Profit
Operating expenses Steady increase in gross profit over the past six years shows prosperous growth of the company. The growth is mainly due to
Distribution Cost 5% 25% 43% 63% -26% 20% reasons mentioned above coupled with effective management of the company’s resources.
Adiminstrative Cost 24% 23% 12% 18% 9% 10%
Other operating expenses 84% 293% -77% 56% 29% 14% Operating Profit
Other income 58% 25829% -98% -17% 15% -73% Profit from operations has registered a compound annual growth of 16.1 % for the same reasons as mentioned above.
19% 32% 14% 42% -7% 15%
Profit from operations 43% 28% -19% 26% 14% 14%
Finance Cost
Finance cost 106% 23% -17% -47% 7% 6% Finance cost has increased over the period due to increase in working capital requirements of the company.
Profit before taxation 35% 29% -20% 51% 16% 17%
Taxation
Taxation 89% 16% -52% 175% 71% -17%
Profit after taxation 34% 29% -18% 47% 15% 18%
Tax expense has increased over the period due to increase in turnover of the company. The company falls under final tax 2018 - 19
Interloop Limited exemptions, if any. Annual Report
regime and the tax is charged on its turnover based on applicable tax rates, after taking into account tax credits, rebates and
70 71