Page 74 - Interloop Annual Report 2018-2019
P. 74

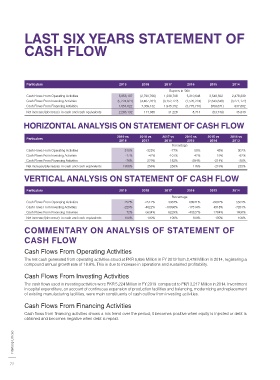
LAST SIX YEARS STATEMENT OF                                                                                                   STATEMENT OF CASH FLOW -


            CASH FLOW                                                                                                                     DIRECT METHOD


             Particulars                             2019      2018      2017      2016      2015      2014                                Particulars                                                    2019                  2018
                                                                           Rupees in ‘000                                                                                                                         Rupees in ‘000
             Cash Flows From Operating Activities     5,856,137    (2,790,766)   1,238,798    5,310,648    3,548,562    2,478,339          Cash flows from operating activities
             Cash Flows From Investing Activities    (5,224,627)   (4,467,281)   (3,152,722)   (1,526,224)   (2,643,640)   (3,271,172)
             Cash Flows From Financing Activities     1,654,622    7,369,132    1,945,152    (3,775,710)   (958,671)   837,882             Receipt from customers                                             36,517,478            28,665,088
             Net increase/(decrease)  in cash and cash equivalents   2,286,132    111,085    31,228    8,714    (53,748)   45,049          Cash paid to suppliers and employees                              (29,041,332)          (30,431,529)
                                                                                                                                           Finance cost paid                                                  (1,001,655)            (422,766)
           HORIZONTAL ANALYSIS ON STATEMENT OF CASH FLOW                                                                                   Income tax paid                                                     (238,195)             (289,281)
                                                                                                                                                                                                                                     (152,194)
                                                                                                                                           Staff retirement gratuity paid
                                                                                                                                                                                                               (131,021)
                                                                                                                                           Workers' profit participation fund paid                             (232,069)             (156,373)
                                                    2019 vs   2018 vs   2017 vs   2016 vs   2015 vs   2014 vs                              Long term loans paid                                                 (14,049)              (14,791)
             Particulars
                                                     2018      2017      2016      2015      2014      2013                                Long term deposits (paid)/received                                   (3,202)                4,317
                                                                            Percentage                                                     Profit on TDRs received                                                182                   225
             Cash Flows From Operating Activities       310%     -325%      -77%      50%       43%      307%                              Interest on loan to Metis International (Pvt) Ltd received               -                  6,522
             Cash Flows From Investing Activities       -17%      -42%     -107%      42%       19%      -82%                              Interest income on loan to SNGPL received                                -                    16
             Cash Flows From Financing Activities       -78%     279%      152%      -294%     -214%     -30%                              Net cash generated from/(used in) operating activities             5,856,137             (2,790,766)
             Net increase/(decrease)  in cash and cash equivalents  1958%  256%  258%  116%    -219%     235%
                                                                                                                                           Cash flows from investing activities
            VERTICAL ANALYSIS ON STATEMENT OF CASH FLOW
                                                                                                                                           Additions in:
                                                                                                                                              Property, plant and equipment                                   (4,632,295)           (3,418,451)
             Particulars                             2019      2018      2017      2016      2015      2014
                                                                                                                                              Intangible asset                                                  (32,798)               (5,576)
                                                                            Percentage                                                     Advance for purchase of land                                             -                 (23,897)
             Cash Flows From Operating Activities       257%    -2512%     3967%    60941%    -6602%    5501%                              Proceeds from disposal of property, plant and equipment             139,466                 65,507
             Cash Flows From Investing Activities      -229%    -4022%   -10096%   -17514%    4918%     -7261%                             Long term investments                                               (699,000)            (1,084,864)
             Cash Flows From Financing Activities       72%      6634%     6229%   -43327%    1784%     1860%                              Net cash (used in) investing activities                            (5,224,627)           (4,467,281)
             Net increase/(decrease)  in cash and cash equivalents  100%  100%  100%  100%     100%      100%
            COMMENTARY ON ANALYSIS OF STATEMENT OF                                                                                         Cash flows from financing activities

            CASH FLOW                                                                                                                      Long term financing obtained                                       (2,568,542)           (1,010,816)
                                                                                                                                                                                                              4,228,002
                                                                                                                                                                                                                                     1,300,000
                                                                                                                                           Repayment of long term financing
                                                                                                                                                                                                                  (847)
                                                                                                                                                                                                                                        (435)
            Cash Flows From Operating Activities                                                                                           Payment of liabilities against assets subject to finance lease     (3,454,937)            7,544,364
                                                                                                                                           Short term borrowings - net
            The net cash generated from operating activities stood at PKR 5,856 Million in FY 2019 from 2,478 Million in 2014, registering a   Share capital issued                                           1,102,558                1,719
            compound annual growth rate of 18.8%. This is due to increase in operations and sustained profitability.                       Share premium                                                      3,782,976                9,576
                                                                                                                                           Dividend paid                                                      (1,434,588)            (475,276)
            Cash Flows From Investing Activities                                                                                           Net cash generated from financing activities                       1,654,622              7,369,132
            The cash flows used in investing activities were PKR 5,224 Million in FY 2019  compared to PKR 3,217 Million in 2014. Investment   Net increase in cash and cash equivalents                      2,286,132               111,085
            in capital expenditure, on account of continuous expansion of production facilities and balancing, modernizing and replacement   Cash and cash equivalents at the beginning of the year            193,687                 82,602
            of existing manufacturing facilities, were main constituents of cash outflow from investing activities.                        Cash and cash equivalents at the end of the year                   2,479,819               193,687

            Cash Flows From Financing Activities

            Cash flows from financing activities shows a mix trend over the period; it becomes positive when equity is injected or debt is
            obtained and becomes negative when debt is repaid.
                                                                                                                                                                                                                                                 2018 - 19
       Interloop Limited                                                                                                                                                                                                                         Annual Report


     72                                                                                                                                                                                                                                        73
   69   70   71   72   73   74   75   76   77   78   79