
Page 106 - InterloopAnnualReport2020
P. 106
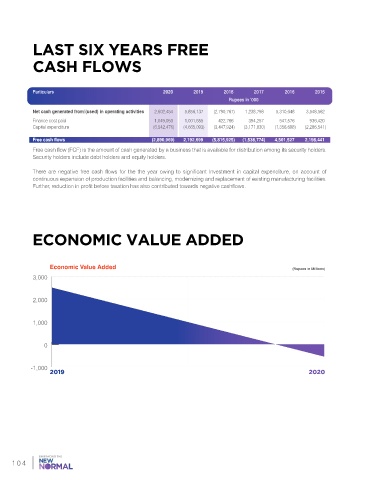
LAST SIX YEARS FREE


            CASH FLOWS


            Particulars                                2020      2019      2018      2017      2016      2015
                                                                             Rupees in ‘000
            Net cash generated from/(used) in operating activities    2,602,454     5,856,137     (2,790,767)    1,238,798     5,310,648     3,548,562
            Finance cost paid                        1,049,053     1,001,655     422,766     394,257     547,576     936,420
            Capital expenditure                     (6,542,476)    (4,665,093)    (3,447,924)    (3,171,830)    (1,356,698)    (2,286,541)
            Free cash flows                         (2,890,969)    2,192,699     (5,815,925)   (1,538,774)    4,501,527     2,198,441
            Free cash flow (FCF) is the amount of cash generated by a business that is available for distribution among its security holders.
            Security holders include debt holders and equity holders.

            There are negative free cash flows for the the year owing to significant Investment in capital expenditure, on account of
            continuous expansion of production facilities and balancing, modernizing and replacement of existing manufacturing facilities.
            Further, reduction in profit before taxation has also contributed towards negative cashflows.


            ECONOMIC VALUE ADDED


                  Economic Value Added                                                            (Rupees in Millions)
            3,000


            2,000


            1,000


                0


           -1,000
                  2019                                                                                 2020


     104