
Page 103 - InterloopAnnualReport2020
P. 103
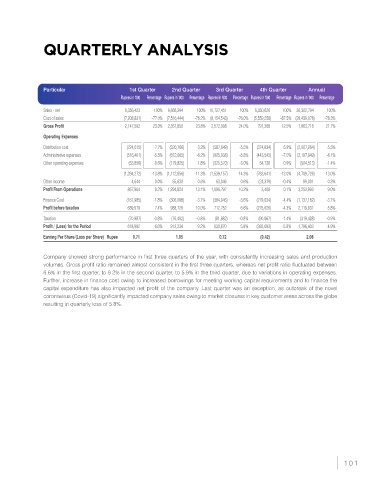
QUARTERLY ANALYSIS


               Particular                   1st Quarter   2nd Quarter    3rd Quarter   4th Quarter     Annual
                                         Rupees in ‘000   Percentage  Rupees in ‘000  Percentage  Rupees in ‘000  Percentage  Rupees in ‘000   Percentage  Rupees in ‘000  Percentage
               Sales - net                 9,356,423    100%   9,868,294    100%   10,727,451    100%   6,350,626    100%   36,302,794    100%
               Cost of sales               (7,208,831)   -77.0%   (7,516,444)   -76.2%   (8,154,543)   -76.0%   (5,559,258)   -87.5%   (28,439,076)   -78.3%
               Gross Profit                2,147,592    23.0%   2,351,850    23.8%   2,572,908    24.0%    791,368    12.5%    7,863,718    21.7%

               Operating Expenses
               Distribution cost            (724,015)   -7.7%   (320,766)   -3.3%    (587,649)   -5.5%    (374,834)   -5.9%   (2,007,264)   -5.5%
               Administrative expenses      (516,401)   -5.5%   (612,065)   -6.2%    (625,938)   -5.8%    (443,545)   -7.0%   (2,197,949)   -6.1%
               Other operating expenses     (53,856)   -0.6%   (179,825)   -1.8%    (325,570)   -3.0%    54,738    0.9%    (504,513)   -1.4%
                                           (1,294,272)   -13.8%   (1,112,656)   -11.3%   (1,539,157)   -14.3%    (763,641)   -12.0%   (4,709,726)   -13.0%
               Other income                  4,644    0.0%    55,630    0.6%    63,046    0.6%    (24,319)   -0.4%    99,001    0.3%
               Profit From Operations       857,964    9.2%   1,294,824    13.1%   1,096,797    10.2%    3,408    0.1%    3,252,993    9.0%

               Finance Cost                 (167,985)   -1.8%   (306,098)   -3.1%    (384,045)   -3.6%    (279,034)   -4.4%   (1,137,162)   -3.1%
               Profit before taxation       689,979    7.4%    988,726    10.0%    712,752    6.6%    (275,626)   -4.3%    2,115,831    5.8%
               Taxation                     (70,987)   -0.8%    (76,492)   -0.8%    (81,882)   -0.8%    (90,067)   -1.4%    (319,428)   -0.9%
               Profit / (Loss) for the Period    618,992    6.6%    912,234    9.2%    630,870    5.9%    (365,693)   -5.8%    1,796,403    4.9%
               Earning Per Share/(Loss per Share)  Rupee   0.71        1.05        0.72        (0.42)       2.06


               Company showed strong performance in first three quarters of the year, with consistently increasing sales and production
               volumes. Gross profit ratio remained almost consistent in the first three quarters, whereas net profit ratio fluctuated between
               6.6% in the first quarter, to 9.2% in the second quarter, to 5.9% in the third quarter, due to variations in operating expenses.
               Further, increase in finance cost owing to increased borrowings for meeting working capital requirements and to finance the
               capital expenditure has also impacted net profit of the company. Last quarter was an exception, as outbreak of the novel
               coronavirus (Covid-19) significantly impacted company sales owing to market closures in key customer areas across the globe
               resulting in quarterly loss of 5.8%.


                                                                                                                   101