Page 102 - InterloopAnnualReport2020
P. 102

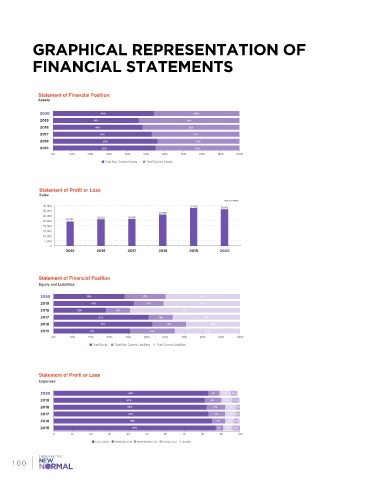
GRAPHICAL REPRESENTATION OF


            FINANCIAL STATEMENTS


              Statement of Financial Position
              Assets

              2020                54%                            46%
              2019              46%                            54%
              2018               48%                           52%
              2017                53%                            47%
              2016                 56%                            44%
              2015                 55%                            45%
                  0%    10%   20%   30%   40%   50%    60%   70%   80%   90%   100%
                                    Total Non Current Assets  Total Current Assets


              Statement of Profit or Loss
              Sales
                                                                           Rupees in Million
               40,000                                           37,478    36,302
               35,000
                                                      31,138
               30,000            26,333    26,529
               25,000  24,150
               20,000
               15,000
               10,000
                5,000
                  0
                       2015      2016      2017      2018       2019      2020


              Statement of Financial Position
              Equity and Liabilities

              2020            38%               22%                40%
              2019             43%               16%               41%
              2018         28%         13%                   59%
              2017                51%                13%             36%
              2016                53%                   18%            29%
              2015             41%                 24%               35%
                  0%    10%   20%   30%   40%    50%   60%   70%   80%   90%   100%
                                Total Equity  Total Non Current Liabilities  Total Current Liabilities


              Statement of Profit or Loss
              Expenses

              2020                          83%                        6%  6%  3%
              2019                         81%                         9%   6%  3%
              2018                         82%                         10%   6%  2%
              2017                          83%                         9%   6%  2%
              2016                          85%                          7%  5%  2%
              2015                           87%                         4%  6%  4%
                  0     10     20    30    40    50    60    70     80    90    100
                                 Cost of Sales  Distribution Cost  Administrative Cost  Finance Cost  Taxation


     100
   97   98   99   100   101   102   103   104   105   106   107