
Page 101 - InterloopAnnualReport2020
P. 101
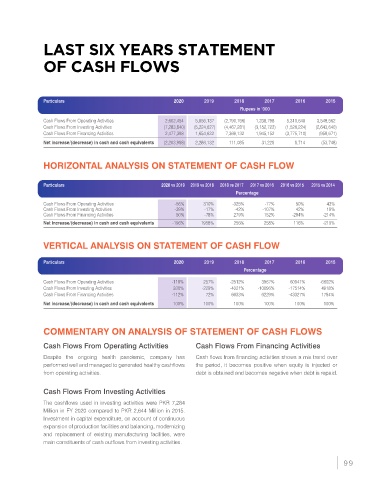
LAST SIX YEARS STATEMENT


               OF CASH FLOWS


               Particulars                                 2020      2019      2018      2017      2016      2015
                                                                                Rupees in ‘000
               Cash Flows From Operating Activities       2,602,454     5,856,137     (2,790,766)    1,238,798     5,310,648     3,548,562
               Cash Flows From Investing Activities       (7,283,840)    (5,224,627)    (4,467,281)    (3,152,722)    (1,526,224)    (2,643,640)
               Cash Flows From Financing Activities        2,477,398     1,654,622     7,369,132     1,945,152     (3,775,710)    (958,671)
               Net increase/(decrease) in cash and cash equivalents    (2,203,988)    2,286,132     111,085     31,228     8,714     (53,748)


               HORIZONTAL ANALYSIS ON STATEMENT OF CASH FLOW


               Particulars                            2020 vs 2019  2019 vs 2018   2018 vs 2017   2017 vs 2016   2016 vs 2015   2015 vs 2014
                                                                               Percentage
               Cash Flows From Operating Activities        -56%     310%      -325%      -77%      50%       43%
               Cash Flows From Investing Activities        -39%      -17%      -42%     -107%      42%       19%
               Cash Flows From Financing Activities        50%       -78%     279%      152%      -294%     -214%
               Net increase/(decrease) in cash and cash equivalents  -196%  1958%  256%  258%     116%      -219%


               VERTICAL ANALYSIS ON STATEMENT OF CASH FLOW

               Particulars                                 2020      2019      2018      2017      2016      2015
                                                                                  Percentage

               Cash Flows From Operating Activities       -118%     257%     -2512%     3967%    60941%    -6602%
               Cash Flows From Investing Activities       330%      -229%    -4021%   -10096%    -17514%   4918%
               Cash Flows From Financing Activities       -112%      72%      6633%     6229%    -43327%   1784%
               Net increase/(decrease) in cash and cash equivalents  100%  100%  100%   100%       100%     100%


               COMMENTARY ON ANALYSIS OF STATEMENT OF CASH FLOWS

               Cash Flows From Operating Activities               Cash Flows From Financing Activities

               Despite the ongoing health pandemic, company has   Cash flows from financing activities shows a mix trend over
               performed well and managed to generated healthy cashflows   the period, it becomes positive when equity is injected or
               from operating activities.                         debt is obtained and becomes negative when debt is repaid.


               Cash Flows From Investing Activities
               The cashflows used in investing activities were PKR 7,284
               Million in FY 2020 compared to PKR 2,644 Million in 2015.
               Investment in capital expenditure, on account of continuous
               expansion of production facilities and balancing, modernizing
               and replacement of existing manufacturing facilities, were
               main constituents of cash outflows from investing activities.


                                                                                                                   99