
Page 100 - InterloopAnnualReport2020
P. 100
VERTICAL ANALYSIS ON
STATEMENT OF PROFIT OR LOSS
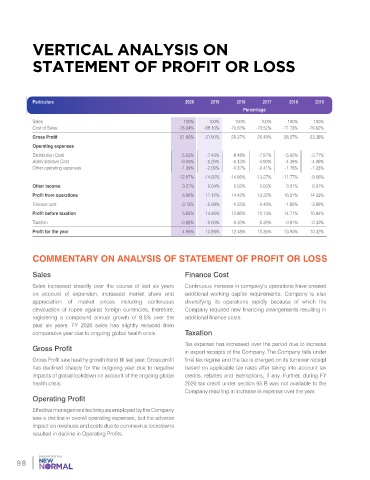
Particulars 2020 2019 2018 2017 2016 2015
Percentage
Sales 100% 100% 100% 100% 100% 100%
Cost of Sales -78.34% -68.10% -70.63% -73.52% -71.73% -76.62%
Gross Profit 21.66% 31.90% 29.37% 26.48% 28.27% 23.38%
Operating expenses
Distribution Cost -5.53% -7.43% -8.48% -7.97% -5.62% -3.77%
Administrative Cost -6.05% -5.29% -5.13% -4.90% -4.39% -4.06%
Other operating expenses -1.39% -2.09% -1.37% -0.41% -1.76% -1.23%
-12.97% -14.82% -14.98% -13.27% -11.77% -9.06%
Other income 0.27% 0.04% 0.03% 0.00% 0.01% 0.01%
Profit from operations 8.96% 17.12% 14.42% 13.22% 16.51% 14.33%
Finance cost -3.13% -2.66% -1.55% -1.48% -1.80% -3.69%
Profit before taxation 5.83% 14.46% 12.86% 11.74% 14.71% 10.64%
Taxation -0.88% -0.60% -0.39% -0.39% -0.81% -0.32%
Profit for the year 4.95% 13.86% 12.48% 11.35% 13.90% 10.32%
COMMENTARY ON ANALYSIS OF STATEMENT OF PROFIT OR LOSS
Sales Finance Cost
Sales increased steadily over the course of last six years Continuous increase in company’s operations have created
on account of expansion, increased market share and additional working capital requirements. Company is also
appreciation of market prices including continuous diversifying its operations rapidly because of which the
devaluation of rupee against foreign currencies, therefore, Company required new financing arrangements resulting in
registering a compound annual growth of 8.5% over the additional finance costs.
past six years. FY 2020 sales has slightly reduced from
comparative year due to ongoing global health crisis. Taxation
Tax expense has increased over the period due to increase
Gross Profit
in export receipts of the Company. The Company falls under
Gross Profit saw healthy growth trend till last year. Gross profit final tax regime and the tax is charged on its turnover receipt
has declined sharply for the outgoing year due to negative based on applicable tax rates after taking into account tax
impacts of global lockdown on account of the ongoing global credits, rebates and exemptions, if any. Further, during FY
health crisis. 2020 tax credit under section 65 B was not available to the
Company resulting in increase in expense over the year.
Operating Profit
Effective management techniques employed by the Company
saw a decline in overall operating expenses, but the adverse
impact on revenues and costs due to coronavirus lockdowns
resulted in decline in Operating Profits.
98