
Page 93 - InterloopAnnualReport2020
P. 93
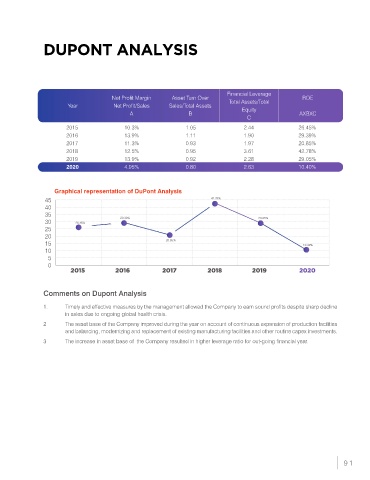
DUPONT ANALYSIS


                                                                            Financial Leverage
                                      Net Profit Margin   Asset Turn Over    Total Assets/Total      ROE
                       Year            Net Profit/Sales  Sales/Total Assets      Equity
                                            A                  B                                    AXBXC
                                                                                   C
                       2015               10.3%                1.05               2.44              26.45%
                       2016               13.9%                1.11               1.90              29.39%
                       2017               11.3%                0.93               1.97              20.85%
                       2018               12.5%                0.95               3.61              42.78%
                       2019               13.9%                0.92               2.28              29.05%
                       2020               4.95%                0.80               2.63              10.40%


                   Graphical representation of DuPont Analysis
                45                                                     42.78%
                40
                35                       29.39%
                30        26.45%                                                       29.05%
                25
                20
                15                                      20.85%                                       10.40%
                10
                 5
                 0
                        2015           2016            2017           2018          2019            2020


               Comments on Dupont Analysis

               1.      Timely and effective measures by the management allowed the Company to earn sound profits despite sharp decline
                       in sales due to ongoing global health crisis.
               2       The asset base of the Company improved during the year on account of continuous expansion of production facilities
                       and balancing, modernizing and replacement of existing manufacturing facilities and other routine capex investments.
               3       The increase in asset base of  the Company resulted in higher leverage ratio for out-going financial year.


                                                                                                                   91