
Page 90 - InterloopAnnualReport2020
P. 90
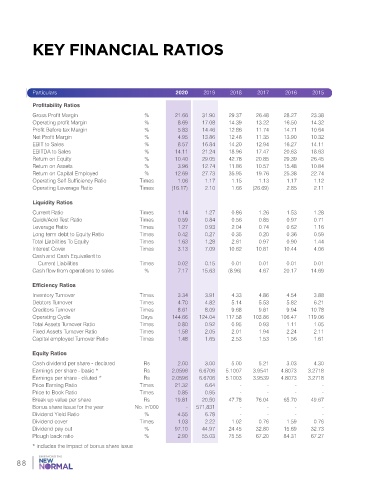
KEY FINANCIAL RATIOS


            Particulars                                    2020     2019     2018     2017     2016     2015

            Profitability Ratios
            Gross Profit Margin                  %         21.66     31.90     29.37     26.48     28.27     23.38
            Operating profit Margin              %          8.69     17.08     14.39     13.22     16.50    14.32
            Profit Before tax Margin             %          5.83     14.46     12.86     11.74     14.71     10.64
            Net Profit Margin                    %          4.95     13.86     12.48     11.35     13.90     10.32
            EBIT to Sales                        %          8.57     16.84     14.20     12.94     16.27     14.11
            EBITDA to Sales                      %         14.11     21.24     18.96     17.47     20.63     18.63
            Return on Equity                     %         10.40     29.05     42.78     20.85     29.39     26.45
            Return on Assets                     %          3.96     12.74     11.86     10.57     15.48     10.84
            Return on Capital Employed           %         12.69     27.73     35.95     19.76     25.38     22.74
            Operating Self Sufficiency Ratio   Times        1.06     1.17     1.15     1.13     1.17     1.12
            Operating Leverage Ratio           Times      (16.17)    2.10     1.66     (26.69)    2.85     2.11

            Liquidity Ratios
            Current Ratio                      Times        1.14     1.27     0.86     1.26     1.53     1.28
            Quick/Acid Test Ratio              Times        0.59     0.84     0.56     0.85     0.97     0.71
            Leverage Ratio                     Times        1.27     0.93     2.04     0.74     0.62     1.16
            Long term debt to Equity Ratio     Times        0.42     0.27     0.35     0.20     0.36     0.59
            Total Liabilities To Equity        Times        1.63     1.28     2.61     0.97     0.90     1.44
            Interest Cover                     Times        3.13     7.09     10.62     10.81     10.44     4.06
            Cash and Cash Equivalent to
              Current Liabilities              Times        0.02     0.15     0.01     0.01     0.01     0.01
            Cash flow from operations to sales   %          7.17     15.63     (8.96)    4.67     20.17     14.69

            Efficiency Ratios
            Inventory Turnover                 Times        3.34     3.91     4.33     4.86     4.54     3.88
            Debtors Turnover                   Times        4.70     4.82     5.14     5.53     5.82     6.21
            Creditors Turnover                 Times        8.61     8.09     9.68     9.81     9.94     10.78
            Operating Cycle                     Days      144.66     124.04     117.58     103.86     106.47     119.06
            Total Assets Turnover Ratio        Times        0.80     0.92     0.95     0.93     1.11     1.05
            Fixed Assets Turnover Ratio        Times        1.58     2.05     2.01     1.94     2.24     2.11
            Capital employed Turnover Ratio    Times        1.48     1.65     2.53     1.53     1.56     1.61

            Equity Ratios
            Cash dividend per share - declared   Rs         2.00     3.00     5.00     5.21     3.03     4.30
            Earnings per share - basic *         Rs       2.0596     6.6706     5.1007     3.9541     4.8073     3.2718
            Earnings per share - diluted *       Rs       2.0596     6.6706     5.1003     3.9539     4.8073     3.2718
            Price Earning Ratio                Times       21.32     6.64        -        -        -        -
            Price to Book Ratio                Times        0.85     0.95        -        -        -        -
            Break up value per share             Rs        19.81     20.50     47.78     76.04     65.70     49.67
            Bonus share issue for the year    No. in’000       -      571,831     -       -        -        -
            Dividend Yield Ratio                 %          4.55     6.78        -        -        -        -
            Dividend cover                     Times        1.03     2.22     1.02     0.76     1.59     0.76
            Dividend pay out                     %         97.10     44.97     24.45     32.80     15.69     32.73
            Plough back ratio                    %          2.90     55.03     75.55     67.20     84.31     67.27
            * includes the impact of bonus share issue


       88