Page 97 - InterloopAnnualReport2020
P. 97

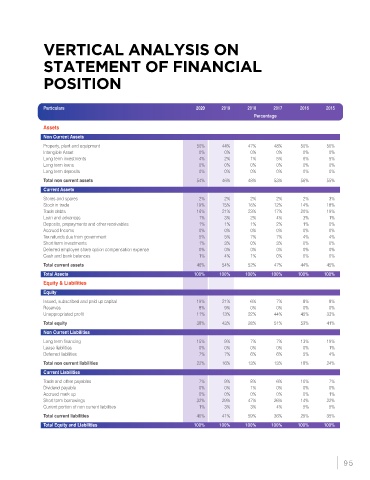
VERTICAL ANALYSIS ON


               STATEMENT OF FINANCIAL

               POSITION


               Particulars                                        2020     2019    2018     2017    2016     2015
                                                                                     Percentage

               Assets
               Non Current Assets
               Property, plant and equipment                      50%      44%     47%      48%      50%     50%
               Intangible Asset                                    0%      0%       0%      0%       0%       0%
               Long term investments                               4%      2%       1%      5%       6%       5%
               Long term loans                                     0%      0%       0%      0%       0%       0%
               Long term deposits                                  0%      0%       0%      0%       0%       0%
               Total non current assets                           54%     46%      48%      53%      56%     55%
               Current Assets
               Stores and spares                                   2%      2%       2%      2%       2%       3%
               Stock in trade                                     19%     15%      16%      12%      14%     18%
               Trade debts                                        16%     21%      23%      17%      20%     19%
               Loan and advances                                   1%      3%       2%      4%       3%       1%
               Deposits, prepayments and other receivables         1%      1%       1%      2%       1%       0%
               Accrued Income                                      0%      0%       0%      0%       0%       0%
               Tax refunds due from government                     5%      5%       7%      7%       4%       4%
               Short term investments                              1%      3%       0%      3%       0%       0%
               Deferred employee share option compensation expense      0%   0%     0%      0%       0%       0%
               Cash and bank balances                              1%      4%       1%      0%       0%       0%
               Total current assets                               46%     54%      52%      47%     44%      45%
               Total Assets                                      100%     100%    100%     100%     100%    100%
               Equity & Liabilities
               Equity
               Issued, subscribed and paid up capital             19%      21%      6%      7%       8%       8%
               Reserves                                            8%      9%       0%      0%       0%       0%
               Unappropriated profit                              11%     13%      22%      44%     45%      33%
               Total equity                                       38%     43%      28%      51%     53%      41%
               Non Current Liabilities
               Long term financing                                15%      9%       7%      7%      13%      19%
               Lease liabilities                                   0%      0%       0%      0%       0%       1%
               Deferred liabilities                                7%      7%       6%      6%       5%       4%
               Total non current liabilities                      22%     16%      13%      13%     18%      24%
               Current Liabilities
               Trade and other payables                            7%      9%       8%      6%      10%       7%
               Dividend payable                                    0%      0%       1%      0%       0%       0%
               Accrued mark up                                     0%      0%       0%      0%       0%       1%
               Short term borrowings                              32%     29%      47%      26%     14%      22%
               Current portion of non current liabilities          1%      3%       3%      4%       5%       5%
               Total current liabilities                          40%     41%      59%      36%     29%      35%
               Total Equity and Liabilities                      100%     100%    100%     100%     100%    100%


                                                                                                                   95
   92   93   94   95   96   97   98   99   100   101   102