
Page 91 - InterloopAnnualReport2020
P. 91
GRAPHICAL REPRESENTATION OF
RATIOS
Our Performance over the Year
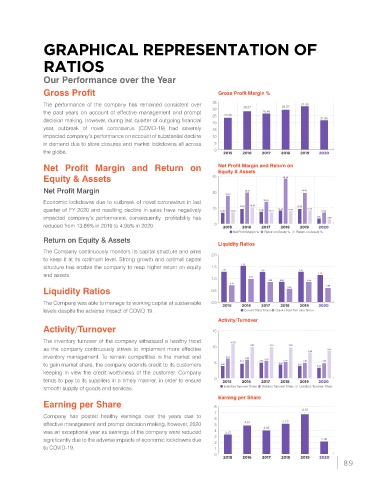
Gross Profit Gross Profit Margin %
The performance of the company has remained consistent over 35 28.27 29.37 31.90
the past years on account of effective management and prompt 30 26.48
25 23.38
decision making, however, during last quarter of outgoing financial 20 21.66
year, outbreak of novel coronavirus (COVID-19) had severely 15
impacted company’s performance on account of substantial decline 10
in demand due to store closures and market lockdowns all across 5
the globe. 0 2015 2016 2017 2018 2019 2020
Net Profit Margin and Return on Net Profit Margin and Return on
Equity & Assets
Equity & Assets 45 42.78
Net Profit Margin 30 26.45 29.39 29.05
Economic lockdowns due to outbreak of novel coronavirus in last 20.85
quarter of FY 2020 and resulting decline in sales have negatively 15 10.32 10.84 13.90 15.48 11.35 10.57 12.48 11.86 13.86 12.74 10.40
impacted company’s performance, consequently profitability has 4.95 3.96
reduced from 13.86% in 2019 to 4.95% in 2020. 0 2015 2016 2017 2018 2019 2020
Net Profit Margin % Return on Equity % Return on Assets %
Return on Equity & Assets
Liquidity Ratios
The Company continuously monitors its capital structure and aims
to keep it at its optimum level. Strong growth and optimal capital 2.0
structure has enable the company to reap higher return on equity 1.5 1.53
1.28 1.26 1.27
and assets. 1.14
1.0 0.97 0.85 0.86 0.84
0.71 0.59
Liquidity Ratios 0.5 0.56
The Company was able to manage its working capital at sustainable 0.0 2015 2016 2017 2018 2019 2020
levels despite the adverse impact of COVID 19. Current Ratio Times Quick / Acid Test ratio Times
Activity/Turnover
Activity/Turnover 15
The inventory turnover of the company witnessed a healthy trend 10.78
as the company continuously strives to implement more effective 10 9.94 9.81 9.68 8.09 8.61
inventory management. To remain competitive in the market and 6.21 5.82 5.53
to gain market share, the company extends credit to its customers 5 3.88 4.54 4.86 4.33 5.14 3.91 4.82 3.34 4.70
keeping in view the credit worthiness of the customer. Company
tends to pay to its suppliers in a timely manner, in order to ensure 0 2015 2016 2017 2018 2019 2020
smooth supply of goods and services. Inventory Turnover Times Debtors Turnover Times Creditors Turnover Times
Earning per Share
Earning per Share 8
6.67
7
Company has posted healthy earnings over the years due to 6
effective management and prompt decision making, however, 2020 5 4.81 5.10
3.95
was an exceptional year as earnings of the company were reduced 4 3.27
significantly due to the adverse impacts of economic lockdowns due 3 2 2.06
to COVID-19. 1
0
2015 2016 2017 2018 2019 2020
89