Page 96 - InterloopAnnualReport2020
P. 96

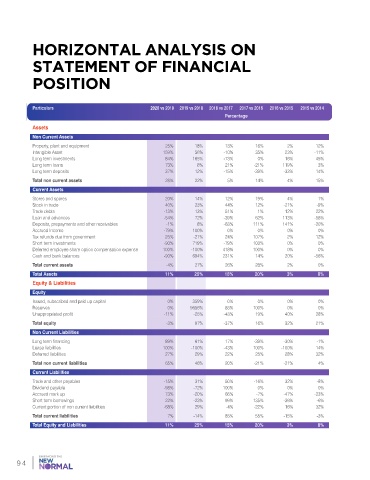
HORIZONTAL ANALYSIS ON


            STATEMENT OF FINANCIAL

            POSITION


            Particulars                            2020 vs 2019  2019 vs 2018   2018 vs 2017   2017 vs 2016   2016 vs 2015   2015 vs 2014
                                                                           Percentage

            Assets
            Non Current Assets
            Property, plant and equipment               25%       18%       13%       16%       2%        12%
            Intangible Asset                           159%       56%      -10%       35%      23%       -11%
            Long term investments                       84%      165%      -73%       0%       16%        45%
            Long term loans                             73%       8%        21%      -21%      119%       3%
            Long term deposits                          37%       12%      -15%      -39%      -33%       14%
            Total non current assets                    28%       22%       5%        14%       4%        15%
            Current Assets
            Stores and spares                           20%       14%       12%       19%       4%        1%
            Stock in trade                              40%       23%       44%       12%      -21%       -9%
            Trade debts                                -13%       13%       51%       1%       12%        22%
            Loan and advances                          -54%       72%      -39%       62%      113%      -58%
            Deposits, prepayments and other receivables   -1%     8%       -63%      111%      141%      -20%
            Accrued Income                             -79%      100%       0%        0%        0%        0%
            Tax refunds due from government             25%      -21%       24%      107%       2%        12%
            Short term investments                     -90%      719%      -79%      100%       0%        0%
            Deferred employee share option compensation expense   100%   -100%   418%   100%    0%        0%
            Cash and bank balances                     -90%      694%      231%       14%      20%       -56%
            Total current assets                        -4%       27%       26%       28%       2%        0%
            Total Assets                                11%      25%       15%       20%        3%        8%
            Equity & Liabilities
            Equity
            Issued, subscribed and paid up capital      0%       359%       0%        0%        0%        0%
            Reserves                                    0%      9656%       85%      100%       0%        0%
            Unappropriated profit                      -11%      -25%      -43%       19%      40%        28%
            Total equity                                -3%       97%      -37%       16%      32%        21%
            Non Current Liabilities
            Long term financing                         89%       61%       17%      -39%      -30%       -1%
            Lease liabilities                          100%     -100%      -43%      100%     -100%       14%
            Deferred liabilities                        27%       29%       22%       25%      28%        32%
            Total non current liabilities               65%       46%       20%      -21%      -21%       4%
            Current Liabilities
            Trade and other payables                   -15%       31%       50%      -16%      32%        -8%
            Dividend payable                           -98%      -72%      100%       0%        0%        0%
            Accrued mark up                             73%      -20%       66%       -7%      -47%      -23%
            Short term borrowings                       22%      -23%       99%      135%      -36%       -6%
            Current portion of non current liabilities   -68%     29%       -4%      -22%      16%        32%
            Total current liabilities                   7%       -14%       85%       55%      -15%       -3%
            Total Equity and Liabilities                11%      25%       15%       20%        3%        8%


       94
   91   92   93   94   95   96   97   98   99   100   101